

There has been a wealth of anchor tests published in the boating press. The tests focus on holding capacity and tend to underline the conclusion that newer anchors are infinitely better than older traditional plow-designs like the CQR, claw anchors like the Bruce, or even Danforth-style anchors like the Fortress. Read an advertisement for one of these new anchors, and you might wonder why the worlds shorelines are not littered with broken boats that have dragged because they were using older-designed anchors.
While our own tests have found the newer concave fluke designs like those found in the Spade, Rocna, and Manson anchors set quickly and have good holding power, we believe the high-quality construction and materials found in genuine CQR and Bruce anchors make them affordable alternatives. We have also found that the Danforth-style anchors are particularly well suited for soft bottoms.
For this article, we have not attempted to re-test holding capacity figures for anchors. There has been a lot of research done in this area, and it is often difficult to correlate the test data to real-world situations. For example, most tests are conducted in seabeds that allow anchors to both set and hold, so setting ability is not usually highlighted. And we often know very little about the seabeds used for the testing, or we can’t compare the seabeds used for tests with the one where we intend to anchor – one of the mariners great imponderables. Because seabeds vary, holding capacities will vary from published results.
The more we looked at anchor data, the more we began to question the methodology used for testing, even in our own tests. So, this is not an article about comparing one anchor against another; this is about the loads on an anchor and what this means for you as you compare makers claims regarding holding power.
Testing: Introduction
For this test, we set out to establish what actual level of load is developed on the anchor of a boat at various scopes, from 3:1 up to 10:1, and various wind speeds, from five knots to 30 knots. The tests generated more questions, some of which we have tried to answer.
There are many published charts of theoretical loads, but data from actual loads is more scarce. Probably the most commonly cited table of anchor loads in the U.S. is the table of theoretical loads used by the American Boat and Yacht Council in its Standards and Technical Information Reports for Small Craft, revised most recently in 2008. Indicating minimum design loads for deck hardware used for anchoring or mooring (cleats, bitts, samson posts, etc.), the table lists calculated loads according to boat size, ranging from 10 to 60 feet. According to that table, the cleat for a working anchor on a 35-foot sailboat should withstand loads up to 5,400 pounds.
In September 2004, we reported on the various tests used to calculate load on rode, including one real-world test by Robert Smith, whose own experiments produced sharply lower figures, nearly 75 percent lower, than the ABYC data used at that time. It is important to note that in both cases-the ABYC theoretical loads and Smiths field test loads-the rode loads were much less than the holding power testers were finding in the matching anchors. In effect, the current crop of anchor tests are telling us that even anchors with less-than-stellar holding power are more than adequate for the typical loads we can expect when anchored.
Does this mean we’re all carrying around way more anchor than we need (not necessarily a bad thing)? We’re doubtful. For one thing, boats with perfectly matched anchors still wind up on the beach. And for another, some of the greatest loads on the anchor occur when you are trying to dislodge an anchor from a stubborn bottom, not when you are anchored with 7:1 scope. So does this mean that the tests are not a fair representation of the way anchors actually work in the field? Perhaps. Regardless, we wanted to take our own look at actual loads on anchors and see how this might affect our upcoming round of anchor tests.
Testing: The Boat
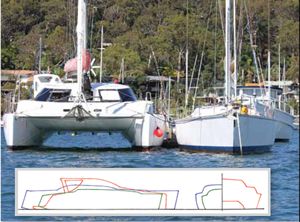
For our test platform, we used an Australian-built, 38-foot Lightwave catamaran, not too dissimilar to a 38-foot Leopard. Most sailors do not own catamarans, so the first thing we did was look at the windage of our test boat for comparison with something a bit more mainstream.
Our local Bavaria dealer was sympathetic to the work and they provided drawings of the 2010 model Bavaria 35 and 45. We were able to compute front and side maximum cross-sectional areas from these drawings and compare with our catamaran, also from drawings. The catamaran has a similar windage, frontal plus side cross-sectional areas, to the Bavaria 45, which has about 30 percent more freeboard than the Bavaria 35.
Windage is a function of the square of the surface area, so the 30 percent difference means the Bavaria 35 has approximately half the windage of the Bavaria 45. We cheated by assuming masts, booms, furled sails, and bimini tops would be proportionate.
Windage is not the only function, weight and underwater profile are also important, but for our purposes, we have ignored these parameters. For comparison, the Lightwave weighs six tons and has two mini keels with 3-foot, 3-inch draft. The Bavaria 45 weighs 12 tons and has a 6-foot, 8-inch draft.
Interestingly, for catamaran owners, most boatbuilders and anchor-makers would tend to recommend an anchor based on length, so a 38-foot cat would have the same anchor as a 38-foot monohull. In our view, overall length alone is not a good benchmark. Windage and tonnage are also important factors.
How We Tested
The testing process was fairly straightforward, but laborious. We chose a location on Pittwater Sound, under Barrenjoey Headland on Sydneys Northern Beaches, Australia. This location is sheltered from developing northeasterly wave action, so the water was fairly flat, even with 30 knots of wind, but subject to the impact of a developing afternoon, northeasterly, summer sea breeze. The seabed is relatively flat, composed of sand patches and seagrass. We anchored for each round of testing in a different sand patch, but all in fairly close proximity to one another. We checked that our anchor did not move during the test using GPS and a marker buoy (and we could see both the marker buoy weight and anchor on the seabed). We anchored at different scopes, varying from slightly less than 3:1 up to 10:1 and measured load on the anchor as the sea breeze developed from 5 to 30 knots.
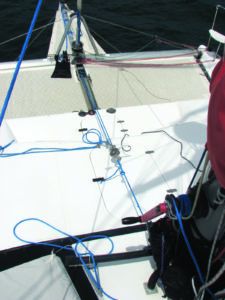
Multihulls usually use a bridle when anchoring because it helps to center and steady the boat. We replaced our bridle with Dyneema and routed this temporary bridle via snatch blocks off each bow, to a central fiddleblock, and then to a load cell located on the bridgedeck.
The load cell was secured with Dyneema through a block on the self-tacking jib track to a mast-mounted winch. The other end was secured to an all-chain rode. Compared to a typical anchoring arrangement which would include a stretchy, shock-absorbing nylon snubber, the elasticity in the rode was negligible, particularly under the low-end loads we recorded. The catenary in the chain, however, did serve to dampen the load.
We measured windspeed at the masthead and correlated that with load (see tables). The windspeed quoted is from the masthead unit. The wind impacts the masthead a few seconds before it impacts the hull, so we knew when to anticipate a significant increase in load. Our rode ratio was based on measurement from bow roller (30 inches above the water) to seabed, and to minimize the impact of tide, we worked two hours either side of high or low water. The maximum tidal differences on Pittwater are seven feet. Anchoring depths were about 16 feet.
Test Results
So what did we find? First a quick explanation of the accompanying graphs, which are based on hundreds of pairs of readings. In generating the graphs, we focused on the maximum or peak loads, since we regard the extreme high loads to be of most interest. (No one wants to base their anchor choices on the lowest loads.) The curves for lower windspeeds are based on actual data; the extrapolations for the higher windspeeds are generated using the formula for the plot. The charts tell the story. The maximum loads decreased with increased scope-hardly an earth-shattering discovery. More important was the amount of load, which generally stayed below 700 pounds at the scope ratio normally recommended for anchoring (at least 7:1). Of particular interest was the fact that virtually all of the peak loads were shock loads, caused as the boat veered about in the wind. However, as the scope ratio increased, the peak snatch loads reduced until at 10:1 scope they had almost disappeared.
It is worth re-iterating that these loads are developed on a multihull with a windage similar to a modern production 45-foot boat. We estimate that a modern 35-foot sailboat would experience loads much lower than those plotted.
We never experienced a long sustained load. The load would develop, to whatever maximum over 15 to 20 seconds, peak and then decrease. This is in complete contrast to how anchors are normally tested, and the basis of those holding capacity figures.
Anchor testing has always been conducted with a winch or tugboat pulling steadily at an anchor in the seabed and when that anchor can be pulled at a steady rate, the load developed is said to be its holding capacity. The tests we conducted demonstrate how this steady-load test is flawed. The severity or speed of development of the extreme loads we measured suggest that fast-pull anchor test, delivered by a faster winch or a moving tugboat, might be more valid than direct-pull anchor testing at a slow speed.
The impact of the wind on a boat is proportionate to the square of wind speed. So 20 knots of wind is slightly less than half as strong as 30 knots, 40 knots is almost double 30 knots, and 52 knots will have three times the impact of 30 knots. The maximum loads we experienced were obviously at low-scope ratios, slightly less than 3:1. The sea breeze was fairly well developed when we did these tests, and we experienced 1,125 pounds of load at 18 knots and 1,400 pounds of load at 23 knots. It is possible these loads are higher for a multihull compared to a monohull, since we presented our bow on cross-sectional area. The experience of these high shock-loads was unnerving and because of this, we suspended testing in high winds at low scope. If possible, a sailor would either lay out more rode or try to move when confronting these sort of impact loads.
An Analysis
Comparing our recorded loads to those recorded during various maximum-load anchor tests, one might conclude that just about any good-quality anchor matched to the right seabed offers more than adequate holding ability in these conditions.
The question then becomes, why then, do so many anchors drag? First off, all anchors can drag. Any anchor maker promising his anchors never drag is full of hot air. If you catch a lost towel, a beer can, or piece of seaweed on the seabed, your anchor will not set correctly-if at all. Even if there is nothing fouling the anchor, if you don’t set it correctly, it will drag. Some anchors need more coaxing than others to set.
Seabeds are not consistent, and if your anchor moves to a harder substrate, it might simply lift out. If the wind direction changes, your anchor might not hold. And few anchor tests take into account wave action, which can generate additional shock loads. In other words, choosing the right anchor for the job is just part of the equation, picking the right spot, and ensuring a good set are also critical factors.
We found that, in our location, our boat was swinging on the anchor through 75 degrees. We also tracked the boat location on the chartplotter, and checked the direction in which the boat was pointing. Our experience in other anchorages, and on other boats, suggest this yawing can vary greatly. Catamarans are notorious for sailing from side-to-side when anchored; a monohull will usually do a better job of staying put. During testing, the wind would gust from one side of the boat and then from another side, forcing the boat to veer. It was this veering that helped to develop the peak snatch loads.
Here is a typical scenario: A gust from starboard forces the boat to veer to port, and two successive gusts from port drive the boat in the other direction, allowing it to develop momentum to accelerate back onto its chain. The chain dragging on the seabed and the weight of the chain help slow the boat, but the gust is strong enough for the chain to jerk bar tight and a develop a snatch load. This veering motion is why the side windage of a boat can have significant impact on anchoring loads, even though the boat might have swung to a more bow-on orientation when the highest load develops.
Our experiences with snatch loads on the water caused us to wonder: Do the existing maximum load tests mimic any real-world situation? A situation that might copy conventional anchor testing would be a boat anchored in a strong tidal flow, which will tend to hold the vessel steady (and stop yawing) with a strong wind superimposed over the tidal flow. The boat would be subject to the tidal flow and the wind. This does occur, but not that often. Wave action might steady the boat but then you have snatch loads caused by wave action to consider.
Results, and Implications
There are possibly a number of options to minimize yawing effect and the development of snatch loads. The Royal Navy practice was to drop a second bow anchor but with only sufficient chain to allow the anchor to act as a friction brake. A kellet to add catenary will help keep the bow pointed into the wind, and increase friction on the seabed. A riding sail (see Practical Sailor July 2011) is also an option.
One approach is to accept the yawing, but try to minimize the shock loads is to use decent snubbers. The theory behind this is not new. Think of one of those young adventurers leaping off a bridge relying for life on a bungee cord. When gravity has done its work and they reach the end of their tether, they feel nothing (other than that adrenalin rush and relief)-all the developed load, or momentum is absorbed by the bungee-no limb-tearing at all.
A decent snubber is a bungee for a boat. Some cruisers are quite content with a long piece of 3/8-inch nylon secured on deck and connected to the chain with a knot or a chain hook. (Our August 2009 article on gripping hitches looked at the various knots that also work for this purpose.) We’ve also looked at a variety of commercial snubbers that offer even more elasticity. Our July 2008 article looked at some of these products. The problem with some of these devices is that they tend to be ineffective at high loads, just when you need them.
A second anchor also makes sense. In winds greater than 35 knots, deploying a second bow anchor at 90 degrees to the first will reduce yawing and almost double the holding capacity. In some anchorages, a line ashore can help reduce yawing, but it can also hold you broadside to the wind, increasing the load on the anchor.
The Peak Load
The maximum load we experienced in our tests was 1,400 pound but this was at a scope slightly less than 3:1. The impact is a bit like driving your boat into a brick wall. It was not pleasant, and the tests were rapidly terminated when this occurred. It is also unlikely that anyone would, like we did, anchor using a 3:1 scope when 20-knot gusts are forecast. Interestingly, our test anchor, a 36-pound Australian Anchor Right Excel, did not move, and it is this lack of movement that makes the impact feel as if you have hit a brick wall. Maybe a less efficient anchor would burrow some, or even drag slightly, to cushion the impact.
Shaft Strength
The tendency of some designs to so thoroughly fix themselves to the bottom in their original orientation brings up another issue-shank strength. Clearly, if an anchor is going to bury its flukes so deeply that it wont budge, the shank needs to be able to sustain not just straight-pull loads, but side-pull loads as well. Any anchor that is used in rock or coral (to be avoided if at all possible) must also have an ultra-strong shank.
If a 1,000-pound load impacts your anchor and that load, imposed by your veering boat, is at a large angle to the direction the anchor is set, then a poorly engineered shank might bend.
Australian anchor maker Anchor Right lets visitors observe its anchor testing, and this has allowed us to see how deep some of the newer designs like the Rocna, Spade, Quickline Ultra, and Manson can dig under controlled load testing. Basically, these newer, quicker-setting anchors work because once they engage with the seabed, they dive. The more you load them, the more they dive, and diving engenders increased holding capacity. Less efficient anchors, and the CQR is a prime example, don’t dig as deep, but as weve mentioned before, they have other admirable attributes. Our experience with a Spade anchor showed that in a 30-knot wind the anchor Spade completely disappears along with the first few feet of chain. When observing other similar diving anchors under testing, we noted the same characteristics. In good sand bottoms, the Bruce types also burrowed completely.
It must be underlined that we specifically chose the test area for its shelter from wave action. Waves must have a severe impact on loads as in addition to changing scopes, if you have 3-foot waves, they also introduce the possibility of more regular and frequent snatch loads.
Much of the testing we have done is not re-inventing the wheel, at best developing some numerical values that reinforce established practice. The work, though far from complete, does raise questions about how anchors react to veering situations, and we will try to address that in our next round of testing this summer.

Graphs developed from testing show the peak loads based on wind speed with scope set at three different ratios, from 4.3:1 (top) to 10:1 (bottom). The graph for 10:1 scope includes projected loads at greater than 30 knots, extrapolated from the formula generated by the plotted curve.
One of the “big questions” we wanted to address was the relevance of standard, maximum-load, straight-pull anchor tests. Here is a look at some common anchor test methods:
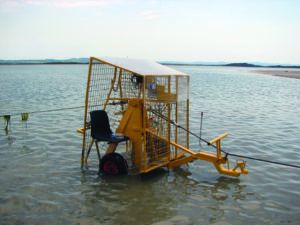
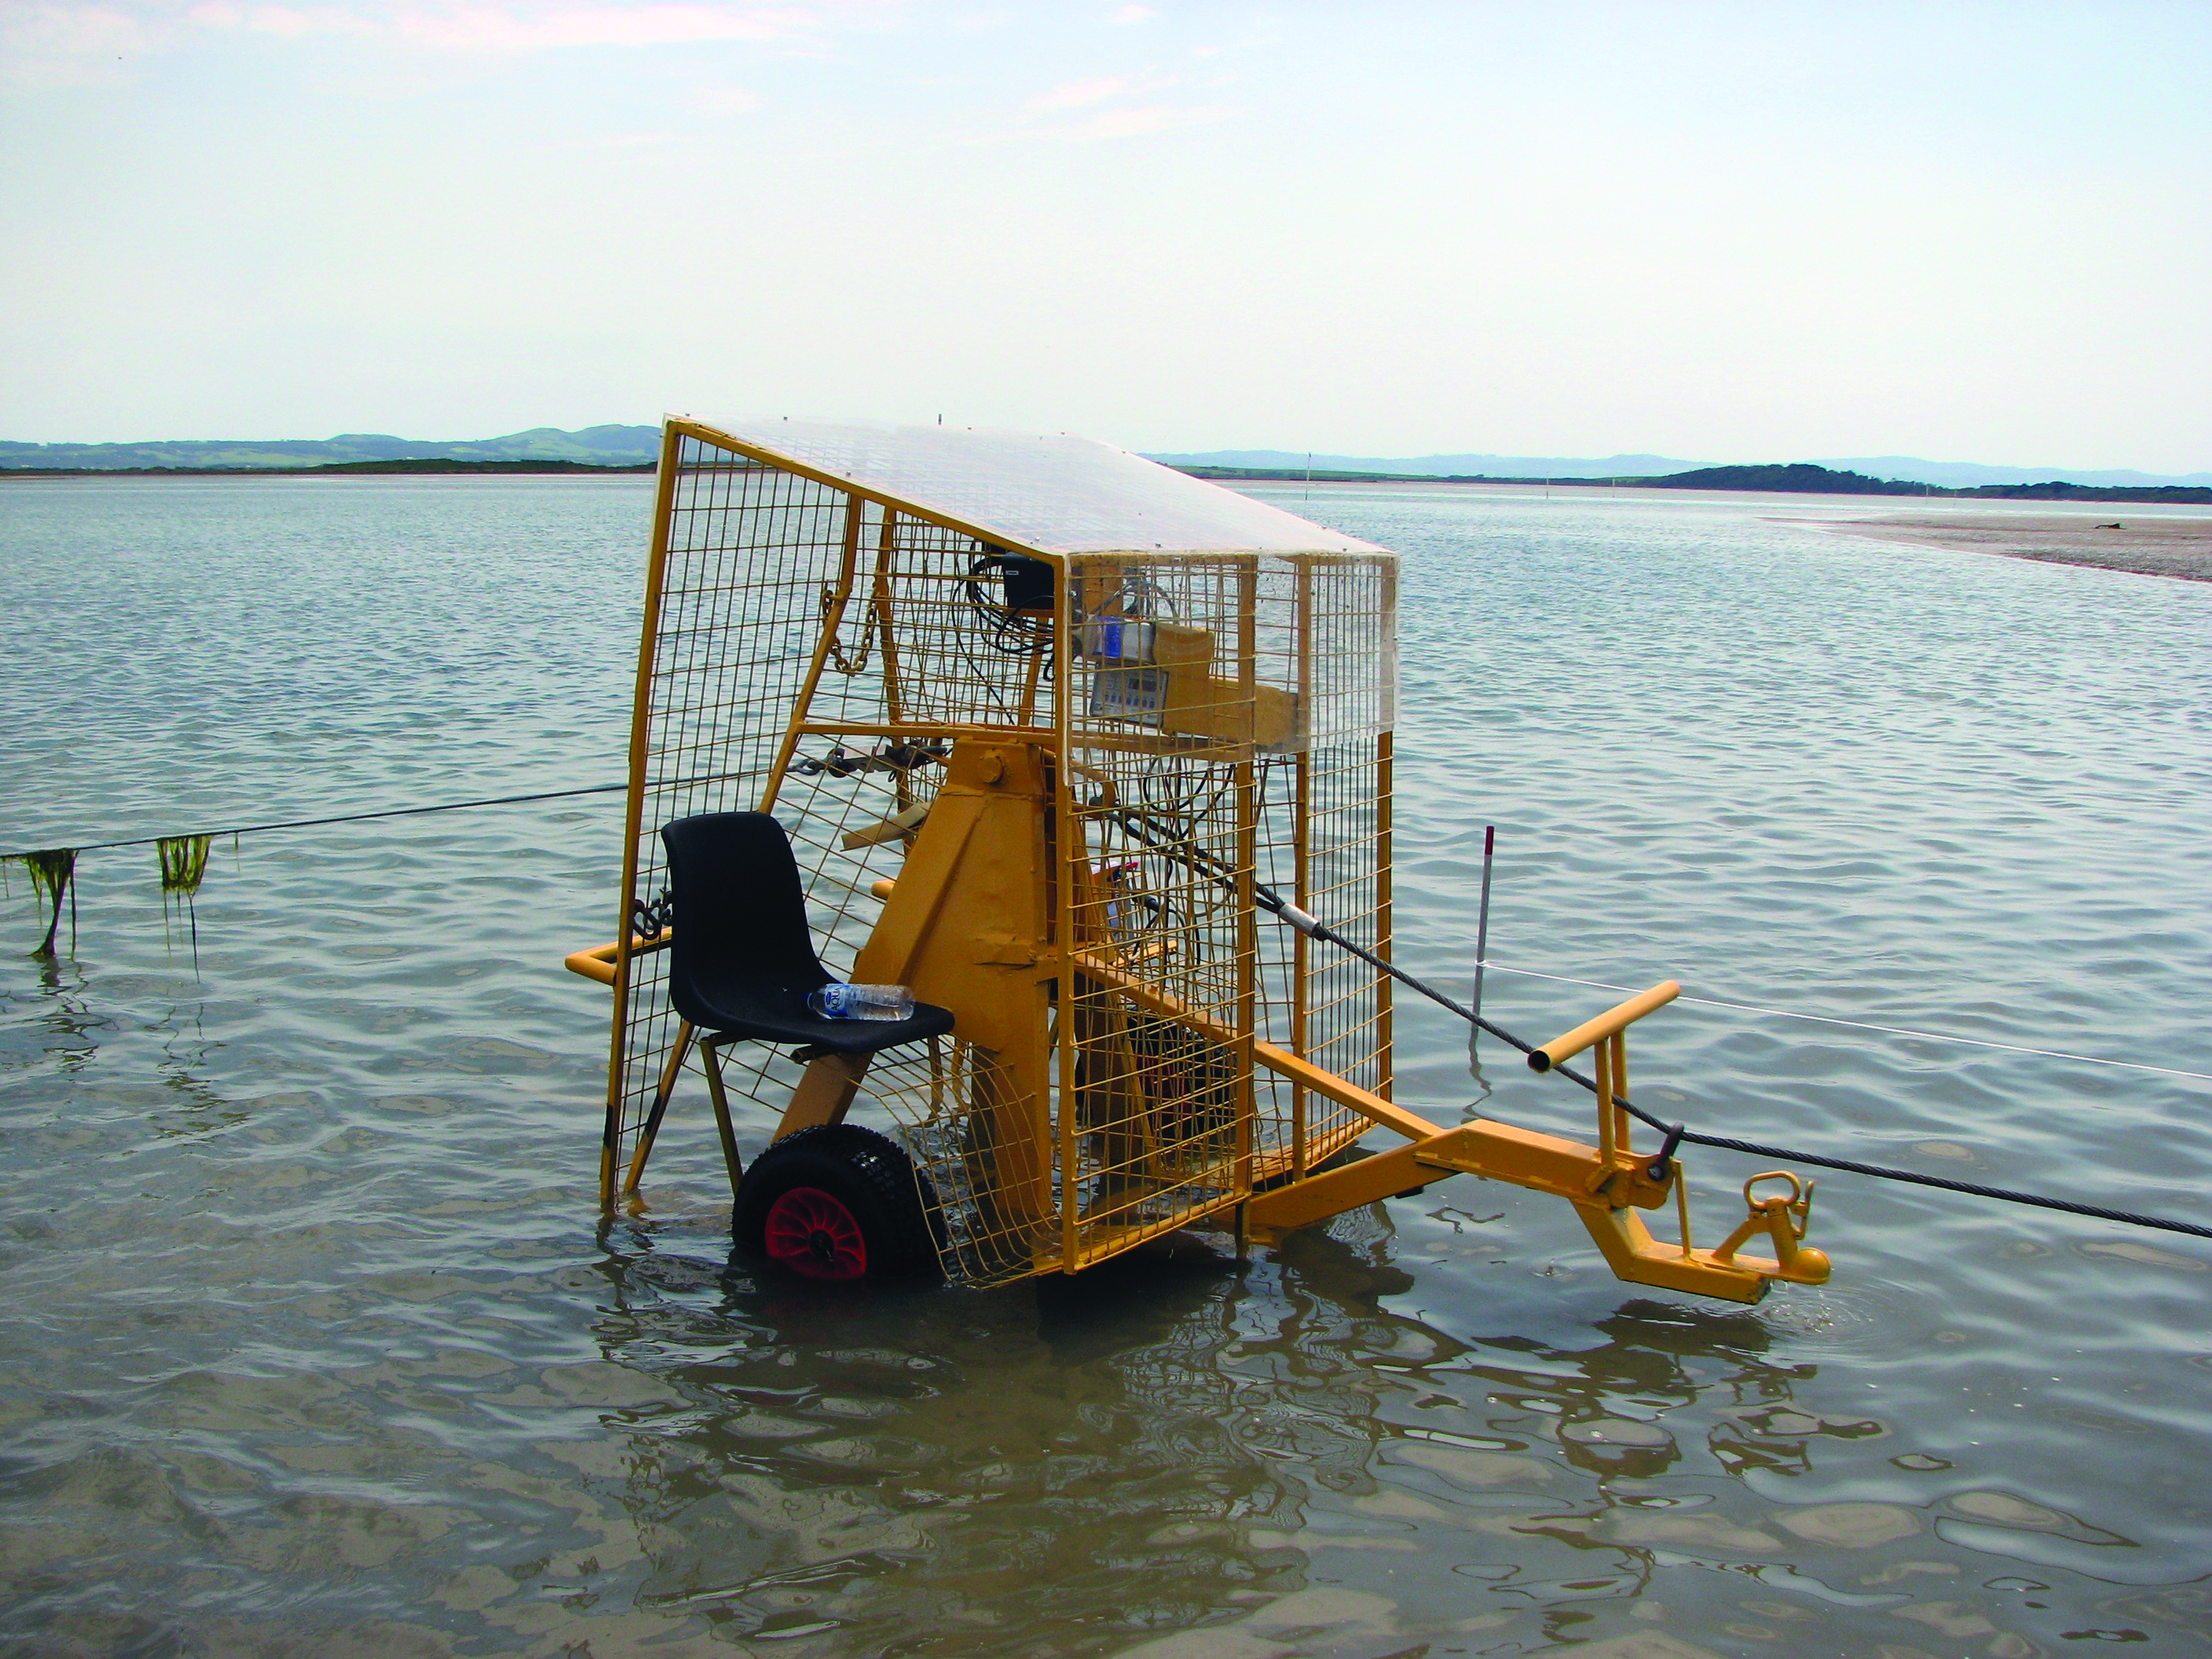

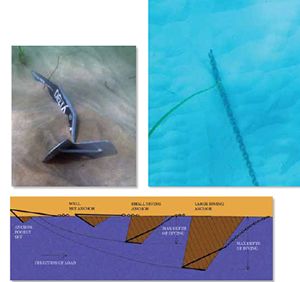
1. Anchor Right uses this cool contraption to test anchors in shallow tidal waters. The anchor is to the left. The rig contains a recorder that prints out the data for analysis.
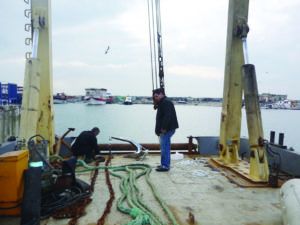
2. Workers prepare an anchor made by Boyut Marine for testing according to SuperHigh Holding Power standards used by the American Bureau of Shipping. Note the monster-sized gear and rode used for testing.

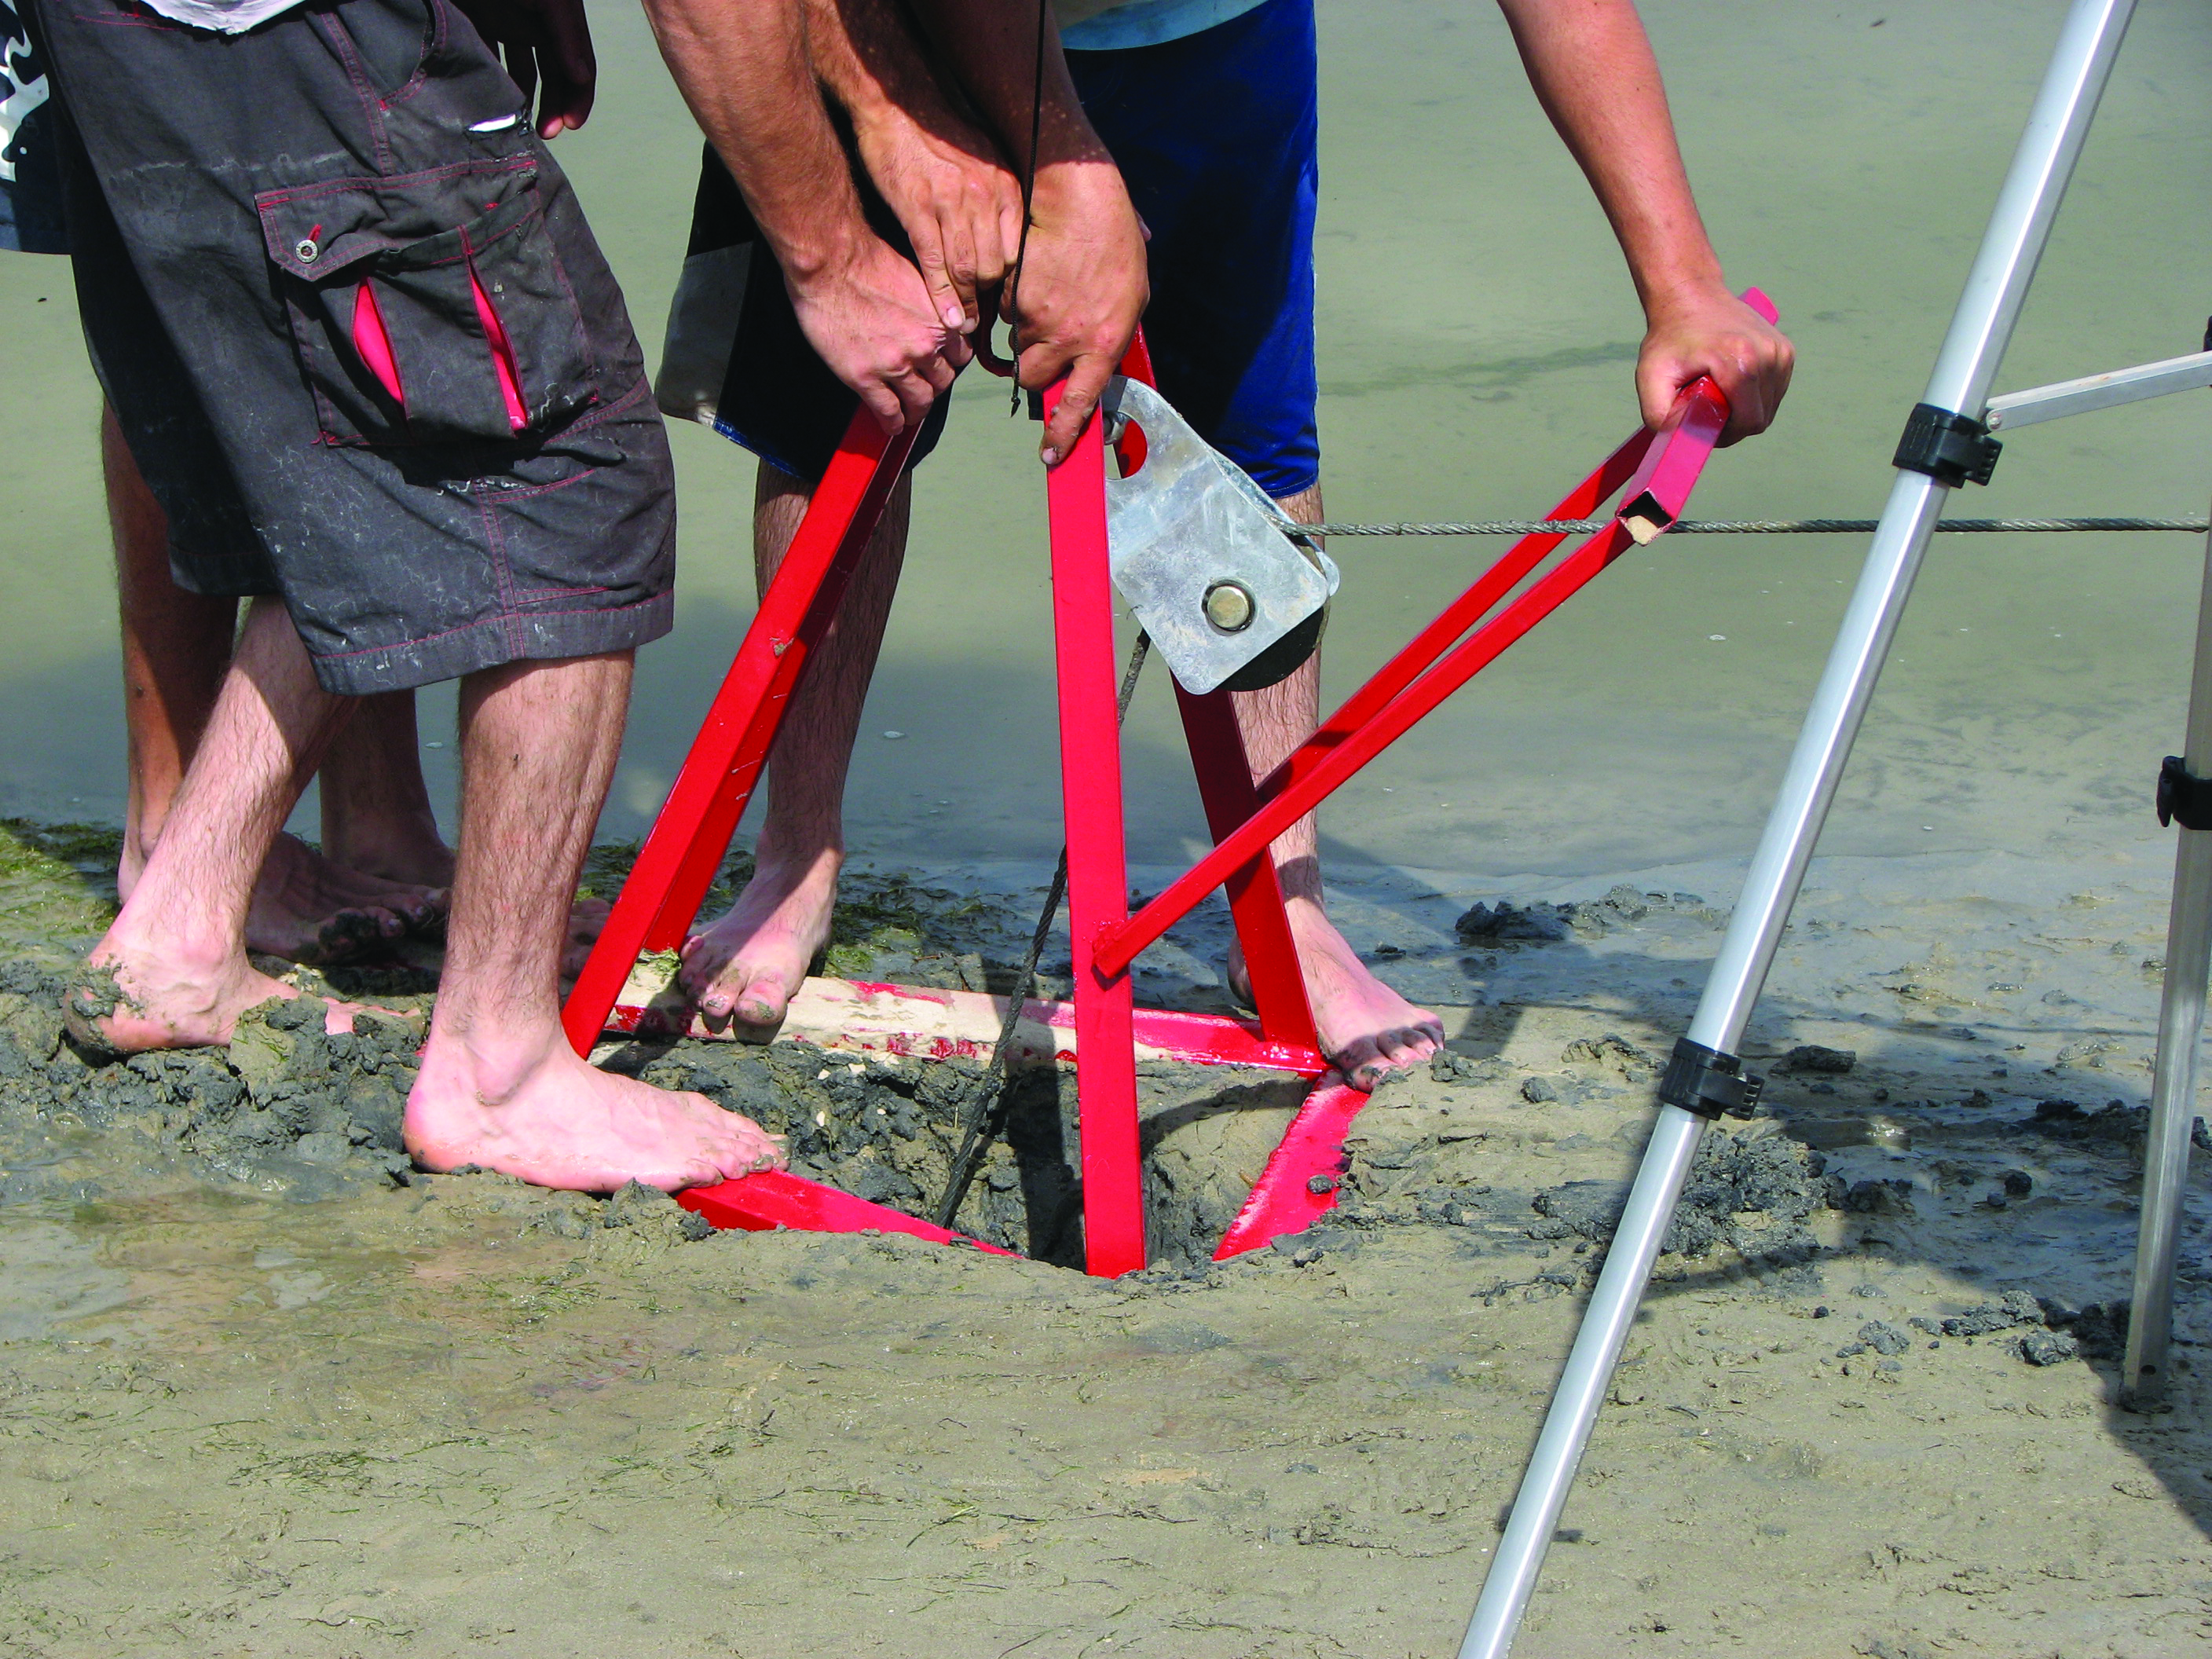
3. Testers for Anchor Right use a special tool to retrieve anchors that have dug into the mud when loaded up to 4,000 pounds (much more than a recreational sailboat will usually develop). Ability to easily break out an anchor is also a key attribute.

Peak loads developed as the test vessel swung around at anchor, suggesting that a well-designed anchor will be able to sustain lateral loads as well as straight pulls used in some tests.
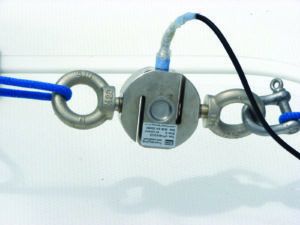
1. A 2-ton load cell we used to measure anchor loads. The data recorder is at the chart table alongside readouts on the chartplotter of the anchored track of the boat, bearing of the boat, wind speed, and depth.
2. Low-stretch Dyneema line (blue) was used between the chain rode and the load cell.
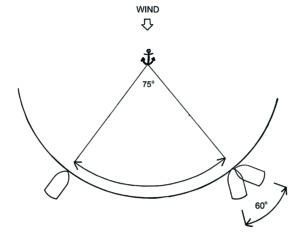
3. Our test boat swung around the anchor through 75 degrees and pivoted a further 60 degrees.


