


By the time U.S. Naval Observatory Superintendent Matthew Fontaine Maury completed his systematic study of the worlds ocean currents and winds in the mid-1800s, the Age of Sail was nearly over. Soon enough, Fultons little experiment with steam cut the value of Maurys data in half.
Maury used thousands of ships logs to produce the first pilot chart of the North Atlantic in 1847. His book, The Physical Geography of the Sea, published in 1855, is regarded by many as the bible of oceanography.
Maurys work may be collecting dust, but wind data is again a valuable commodity. As the Age of Windpower gains force, the Earths surface and atmosphere bristle with wind sensors. Orbiting satellites use scatterometry to measure near-surface winds over the ocean. Wind (and current) data from satellites, weather buoys, and autonomous craft spills into vast databases accessible via the Internet, ready to be mined.
The biggest beneficiaries of this wind-sensor explosion are wind-energy firms, but offshore sailors reap the benefits as well. Sea-buoy data give us real-time snapshots of wind and sea state. And we have at our disposal a variety of weather-routing programs to crunch this data.
Far overshadowed by this vast data stream, Maurys work stubbornly lives on. The U.S. Atlas of Pilot Charts (Publications 105-109) is the direct descendant of Maurys first Atlantic charts, and PS recently had the chance to look at a passage-planning software, Visual Passage Planner, that is based on the pilot charts.
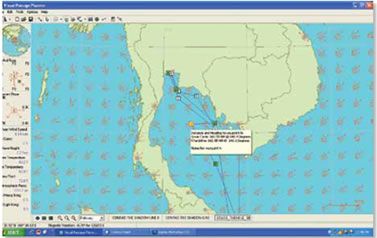
Developed by Pennsylvania-based Digital Wave, the software is simple to use. You just select the month you will be sailing, zoom in to the area of your passage, and start dropping waypoints. Select from the top menu what data layers you would like to see. Choices include wind, current, sea state, water temperature, and air temperature. The wind layer instantly yields a grid of wind roses, indicating the average wind strength and direction, as well as the number of days of calm, for the charts time period.
For this evaluation, we decided to use the Visual Passage Planner to re-create a historic passage by Joseph Conrad in 1888. By Conrads account, retold in the semi-autobiographical novella The Shadow Line, the passage was hellish. On this, his first command, he was stuck with an unfamiliar ship, the iron barque Otago, in an unfamiliar port (Bangkok), with a crew stricken by tropical disease. The previous captain had died on board, and the first mate was convinced the ship was haunted by his ghost. The trying passage to Singapore, just 820 miles away, took an excruciatingly slow 21 days.
So what took the Otago so long?
Using Visual Passage Planner, we dialed in February for the Gulf of Thailand (Conrads Gulf of Siam) and had a look at what Conrad faced. A couple of wind roses in the center of the Gulf were intimidating -11 days of calm, nine days of calm, 10 days of calm. Along the east side of the Gulf, however, one could see fewer calms, and the variable directions suggested land and sea breezes.
Under sail, provided you were confident enough to follow a coast-wise route, you could play the land breezes at night, and if you were lucky, the sea breeze during the day.
How much time would you save taking this route? We used Visual Passage Planner to evaluate several different routes. We also tried the programs Auto Route Optimization feature, which picks what route it thinks you would like, based on your preferences. (A no ghosts preference is not an option.)
Projected passage times will, of course, depend on what you are sailing, and you establish this by entering some basic information about your boat in your vessel profile. The vessel profile setup asks for your waterline length and allows you four choices of sailboat displacement types: light displacement, heavy displacement, multihull, and race.
With this information, the software generates boat speed/wind velocity curves for four points of sail: beat, close reach, broad reach, and run. You can manually adjust these curves to suit the boats performance and select the percentage of predicted speed to be used in simulation. For instance, if theres some heavy chop slowing you down, you might hit only 60 percent of the predicted maximum on a beat. Once youve set your vessel profile and picked your route, you can generate a variety of table-like reports. The vessel performance report provides details like distance sailed, speed made good, average wind force, and the mean wind directions for each leg.
This passage planner shouldnt be compared to true weather-routing software like the weather-routing module from MaxSea, which uses a boats polar data to evaluate real-time routing. The U.S. Pilot Chart data used by Visual Passage Planner is based on historic averages, not real-time wind speeds. Coastal routes, in particular, can vary greatly from the historical average.
Coming up with a vessel profile for the Otago, a barque with a waterline length of approximately 147 feet, required some minor tweaks. The software assumes that even a heavy-displacement vessel can beat upwind at 45 degrees true. The closest reach on Otago was probably closer to 66 degrees true. By adjusting the wind velocity/speed curve, we were able to generate a close approximation for the Otagos performance.
So what was the score? According to the Vessel Prediction Program, the rhumb line route from Bangkok to Singapore should have taken Conrad just over seven days. The slowest route took 14 days, and included a long zag into the middle of the Gulf of Thailand. In fact, finding a route that matched Conrads ultra-slow, 21-day February passage required some significant detours from the rhumb line.
Conclusion
The result highlighted a key point about Visual Passage Planner. It doesn’t matter if the passage youre planning is in 1880 or 2012, the predicted passage times for many passages can be misleading, particularly when applied to short coastal routes. All it takes is one stalled low or passing front to upset the typical wind pattern.
Long tradewind routes are more likely to match historical patterns. Winds are more reliable, and the long passage time will balance out inconsistencies.
Mostly, this is a fun program to fiddle around with, dream, and ask questions like: Can I sail to New Zealand before the Rugby World Cup?
We found the interface to be straightforward and the program was relatively stable. You can download Visual Passage Planner for $120, or buy the DVD for $130 at the Digital Wave website. A limited, 30-day trial download is free. And if you don’t like computers, but still want to sail among Maurys windroses, you can download free PDF versions of U.S. Pilot Charts through the National Geospatial-Intelligence Agency web portal. Another option is Jimmy Cornells World Cruising Routes, a hefty guide that includes discussions of the worlds main cruising routes.
And for real-time weather, a peek out the companionway and a tap on the barometer usually offer some useful information as well.


