

Electronic charting, whether in the form of dedicated chartplotters that live on your boat or software that lives on your computer, is definitely the wave of the present.
There are a number of good reasons for this technology’s growing popularity. Most of these programs do much more than simply draw charts—they create and remember routes; most download waypoints you select to your GPS and/or autopilot; and most receive data from your GPS and self-correct their displays if you wander off course. They can also prepare float plans, keep logs, identify range and bearing for visual fixes from your planned waypoints and perform a host of functions too varied to even think of listing here.
While the software approach has one fundamental drawback compared to the chartplotter—it requires a computer—it has several significant advantages. The display is larger, more functions are supported and future upgrades are feasible without trading in an expensive piece of hardware.
For this report, we compared two popular software packages: The Cap’n (a cute acronym for Computerized American Practical Navigator) and Nobeltec’s Visual Navigation Suite. They both perform many of the same functions but with significant differences in approach.
Charting software was most recently evaluated in the February 15 and August 1, 1999 issues. It’s a test program we approach with a fair degree of caution. Not all programs do all the same things and all continually add functions and features. And, as is the case with most software, it takes a lot of practice to gain familiarity with the various features.
To make it even more complicated, readers who already own the software often become both highly expert and partisan. We’ve come to expect a good deal of argumentative correspondence when we report on this type of product.
What They Are
Essentially, charting software programs are electronic representations of paper charts with provision for course plotting, printing, record keeping, interfacing with GPS and autopilot and a host of other features. If you take a laptop aboard, they’re also real-time course trackers. Typically, charting information is supplied on a CD-ROM. Almost all the programs available are intended for personal computers using Windows.
Evaluation Criteria
When evaluating a multi-functional product like electronic charting programs, criteria can be highly subjective. We decided to start out with a consideration of what seems not important to most boat owners.
For many owners, charting software works best at home, where you can plan a route in comfort and then download waypoints to a GPS.
Because you should have paper charts anyway (the software publishers themselves are emphatic on this point), we’ve come to feel that quality of printouts is less important than previously considered.
Record keeping—float plans, logs, etc.—may be important to some people and not to others. We’ll list these features but not use them as rating factors.
Ease of use is the main justification for using a charting program, rather than relying on the traditional approach of paper charts, protractors and dividers. Therefore, we’ve put heavy emphasis on convenience factors such as ease of loading charts, zooming in and out, creating a course, modifying a course and quality of documentation.
The clarity of charts displayed on the screen is extremely important, as is the ease and precision of zooming in to see more detail and zooming out to cover more area. A computer screen, especially a laptop screen, is tiny compared to a paper chart, so a fair amount of zooming in and out is required.
Ease of planning a route—selecting waypoints, placing specialized marks on the chart for fishing spots and the like—is a fundamental requirement. Since you usually plan a trip by roughing it out on a small-scale (large area) chart and then zoom in on individual legs, it’s important to be able to move, add and delete waypoints.
Because of screen size, it’s usually not possible to keep the entire route on screen while maintaining a usable level of detail. It’s important to pan or move over to a portion of the chart off screen. Ease of panning and precision of control of panning are crucial.
Most charting programs allow you to download waypoints to a GPS, but the ability to make corrections from a GPS is only of importance if you’re able to use your computer onboard. The program should be able to store a large number of routes and display only the one you’re working with (screens get cluttered easily).
We like programs that automatically calculate bearing and range for visual fixes along a route. Tide and current information is, of course, extremely important. How this is presented in terms of clarity and ease of application is noted.
Raster Charts
One of the side effects of the digital electronic revolution has been the increasing need to comprehend the technology purchased. Charts are no exception. Terms like raster, vector and quilting are important to understanding how these programs work—and their strengths and limitations.
Raster charts are the electronic charts most commonly encountered today. They’re simply direct copies of paper charts converted to digital form with a scanner. Relatively cheap and simple to produce, they’re as accurate as the paper charts they’re scanned from, but they do have some limitations.
A raster (or bit-mapped) chart is made of tiny colored dots, or pixels; when enlarged or zoomed in on, the image is enlarged but the number of pixels remains the same, producing a less-crisp image with fuzzy lines. A second problem with raster charts is the amount of storage space they require—each pixel is stored as a separate piece of information. A third problem stems from the fact that paper charts are not always the same size or orientation and are drawn to different scales. With a raster chart, when panning to the end of the chart, it’s necessary to install the next chart, which can be a nuisance if the chart happens to end in the area toward which you’re heading.
Software designers have addressed this last problem through a technique known as quilting. The computer adjusts the chart’s orientation and size automatically to give the illusion of one continuous chart.
Quilting, even when it works well, tends to degrade the quality of the chart and considerably slows panning and zooming. When it doesn’t work well, it can produce some strange graphic effects. Still, we find that in general we prefer the illusion of one large chart over having to click the top of the next chart when you reach an edge.
Vector Charts
An alternative to the raster chart is the vector chart. Where a raster chart requires that the computer store the color and position of a large number of pixels (several hundred per linear inch of chart), a vector chart needs to store only the beginning, the length and the direction of the line. A one-inch narrow line on a raster chart requires several hundred pieces of information; the same line on a vector chart needs only three.
Further, a vector chart can be stored and displayed in layers—the basic geographical shape might be on one layer, the depth numbers on another and the light and buoy list on a third. A vector chart lets you display only the data you want to see, offering a large improvement in clarity.
When you zoom in on a vector chart, there is no fuzzy effect as with a raster chart. It’s theoretically possible to have a single large vector chart of the world, with the capability of zooming in on any area of interest—no quilts and no edges.
As yet, this hasn’t been done (although some on-land mapping programs work this way), possibly because the vector charts are redrawn from the original paper charts. A vector chart costs more for a master but is smaller and therefore somewhat cheaper to produce than a raster chart.
The earliest charting programs used vector charts to conserve disk storage and memory. These charts were crude, however, and as computers became faster and more powerful, they gave way to scanned raster charts. Most recently, vector charts have been staging a comeback, with vastly improved detail and graphics compared to their predecessors.
The latest wrinkle in raster charts is the digitized photograph. Maptech is producing disks that contain aerial photographs as well as raster charts. The Cap’n is providing charts (as an option) with a graphical representation of a 3-D view of the bottom contours (see photo on the next page). We looked at both and both struck us as interesting and attractive but not all that useful.
The Cap’n uses raster charts and doesn’t support quilting (though the graphical view of the sea floor is an option). Nobeltec’s Visual Navigation Suite supports vector charts as well as raster charts (with quilting) and aerial photos.
Findings
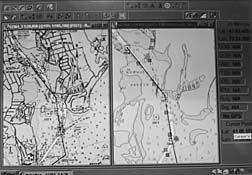
Both programs work. Both allow you to plan and edit course, load waypoints into a GPS or autopilot, print (but see below) and provide an onboard moving-map display of position. Both allow you to zoom in and out and choose the scale of the chart you wish to display. The Cap’n uses raster charts only (an optional add-on allows you to display wire-cage representations of bottom contours, but these are not the primary tools for planning trips). The Cap’n doesn’t support quilting. This makes for sharp, clear charts but means that when you reach the edge of a chart you either have to open a new chart or switch to a smaller- scale, larger-area chart (see photo on page 35).
Nobeltec’s Visual Navigation Suite features the best vector charts we’ve seen. The charts occupy less storage space than raster charts, so Nobeltec has been able to supply its program and all the charts covering the entire world on a single CD-ROM. You must contact Nobeltec to purchase a “key” to decode the areas you are willing to pay for.
Visual Navigation Suite also supports the commonly available raster charts (with quilting) and allows you to view aerial photos if available. Performance with raster charts is OK, though their charts aren’t included with the software.
What’s really impressive about this system, however, is the presentation that vector technology can provide, particularly for highly detailed, small- area charts. Sharp and clear outlines replace the thick and jagged ones we’ve become used to when we zoom in on raster charts. And the chart information is stored in the electronic equivalent of transparent layers so that bottom contours, depth data and buoy and landmark positions can be added or removed as desired, as can tide and current information that is presented graphically right on the chart. (The Cap’n also presents tide and current information, but in a less direct fashion.)
Zooming and panning are much faster and easier to control than with raster charts. And you can even choose from eight coloring schemes to improve readability in varying light.
Do you give up anything with vector charts? Well, many of the onshore details, such as roads and buildings, that appear on raster (and paper) charts have been omitted. In general, we think this helps maintain clarity, though some of your pet landmarks may not appear. And buoys are presented as red or green solid squares or circles rather than the dot-and-diamond format we’ve become used to.
In general, you’re not aware of the fact that Nobeltec’s raster charts have been developed from a large number of separate charts—quilting is, for the most part, excellent, but there is an occasional reminder.
A minor irritation: While switching from Nobeltec’s small- to larger-scale raster charts is easy (you just click on the chart and a menu opens up listing the available charts), you have to click again to find out what chart you’re currently using and then go back to select a new one.
Both The Cap’n and Visual Navigation Suite also perform a dizzying array of functions, such as keeping a log, reversing a route, preparing a float plan, calculating fuel consumption, marking alarm zones and so on. The Cap’n has a few functions, such as compass deviation, that Nobeltec doesn’t. Both programs can make planning and record-keeping a snap. But a major problem with either is finding enough time to figure out how to do everything.
Conclusions
Despite The Cap’n’s many nice features, we think that the limitation of individual, non-quiltable charts is an almost overwhelming drawback, especially for navigators who don’t travel far from home (lack of detail isn’t too important once you leave the coast). Nobeltec’s vector charts are clearer and less cluttered than The Cap’n’s raster charts. Nobeltec’s raster charts are fuzzier, even with diamond-view.
Compared to on-land mapping programs, however, both have a long way to go. Microsoft’s Expedia, for example, is a mapping program that presents the entire United States as a single vector map. It allows you to zoom easily from 1 to 8,700 miles, pan easily and quickly from any portion of the map to any other, maintains the center when you zoom and prints whatever’s on the screen. We wish that The Cap’n and Nobeltec’s Visual Navigation Suite were as well-behaved (we have little doubt they will be in the future).
What about photos and bottom contours? In our opinion, they’re fun to look at and very pretty, but of limited use in navigation. In any case, it’s important to remember that no matter how good these programs become—and we think that, even today, they’re pretty impressive—they’re not necessities. You must keep paper charts aboard anyway, and unless you have much more faith in the reliability of computers than we do, you should learn to do your navigation the old-fashioned way.
Of the two, we’d choose the Visual Navigation Suite.
Also With This Article
Click here to view “Value Guide: Nav Software Programs.”
Contacts- Nobeltec, PMB #132, 14657 SW Teal Blvd., Beaverton, OR 97007-8499; 800/598-4976; www.tides.com; www.nobeltec.com. The Cap’n, Nautical Technologies, 217 Burleigh Rd., Bangor, ME 04401; 800/637-4020; www.thecapn.com.