
With all the talk about a record El Niño coming this summer and climate change generally leading to more severe storms, we all need to read up on weather monitoring—tropical storms don’t stay in the tropics. The remnants curve up the eastern seaboard of the U.S. and follow the gulf stream across the Atlantic. The west coast ones can impact all the way up to the Pacific Northwest, bringing strong winds and heavy rain to Oregon, Washington and British Columbia. I once got stuck in Cork Harbour, Ireland for a week while the remnants of a hurricane ripped through with severe gales and 30-foot seas.
Extended Coverage Area
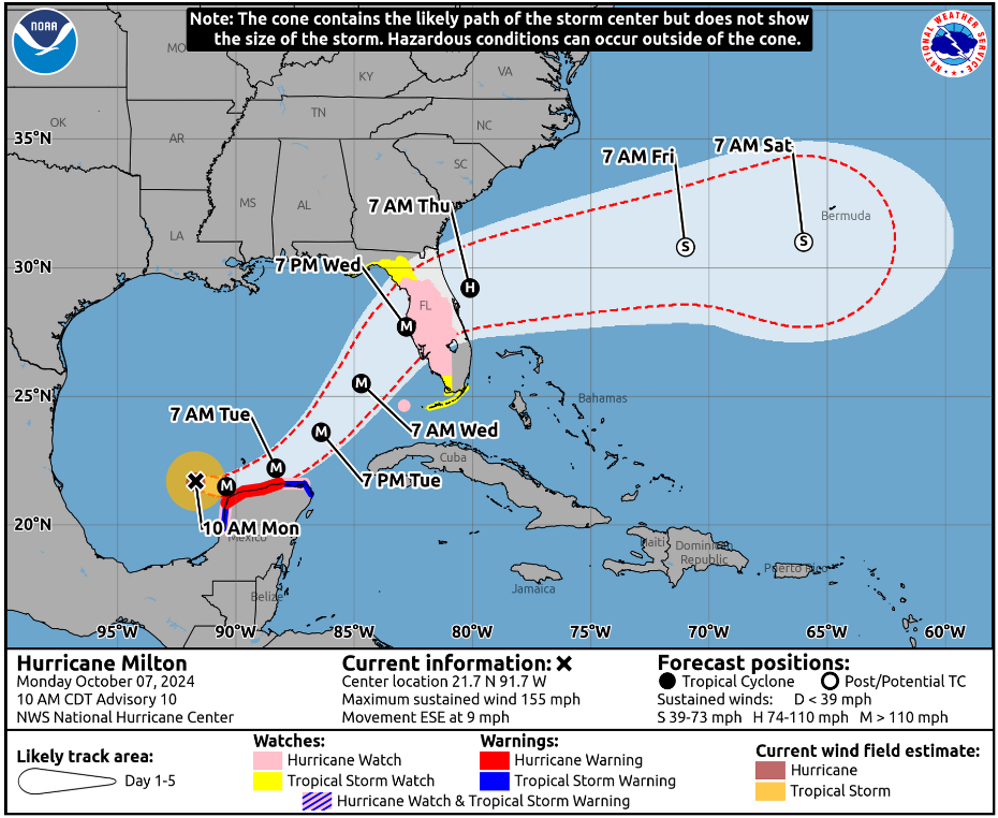
The most notable change in the National Hurricane Center’s (NHC) services are some big extensions to the coverage area. Previously, the focus of hurricane watches was firmly centered on warning ships at sea. This has now changed and will include storm tracks across the continental U.S. land mass. This will be useful for anyone with a boat on the inland waterways but should also be a great help for many boats in harbors on the eastern seaboard.
Previously, if a tropical storm made landfall in the Gulf of Mexico and crossed in a north-easterly direction overland, there would be no detailed information about it until it emerged back into sea on the east coast. True, most storms lose intensity overland, but they can still bring some severe weather. Being able to continue tracking their progress and intensity as they cross the land means more accurate and detailed information can now be followed on the same forecast map for anyone in an east coast harbor.
Storm Surge
The other significant extension to coverage is the inclusion of storm surge watches to the coast of Hawaii. Storm surge is frequently the most damaging aspect of hurricanes. We can batten down the hatches and double the mooring lines but a 10-foot storm surge can lift the entire pontoon from its mountings. Mooring or ground tackle laid assuming a depth of 15 feet run out of scope when that suddenly becomes 25 feet. Most damage to boats during tropical storms is not done at sea, it is to boats on mooring or at anchor, in marinas and in dry storage on land. So, any additional information about storm surges is welcome.
Storm Track
There are also some changes to the way the information about storm track is displayed. This shows the difference between the old and new track cones. The map shows a slight reduction in the area because the track predictions are getting more accurate. An important note, however, is a reminder that this shows the probable track of the eye, not the extent of the storm. Dangerous conditions will be experienced well outside the cone. Aim to get at least 100 miles clear of the cone and remember that the large swells generated can travel hundreds of miles if it is a major storm.
Wind Speed Mapping
A potentially useful, but still experimental change in NHC services, is wind speed mapping. This is the example they give:
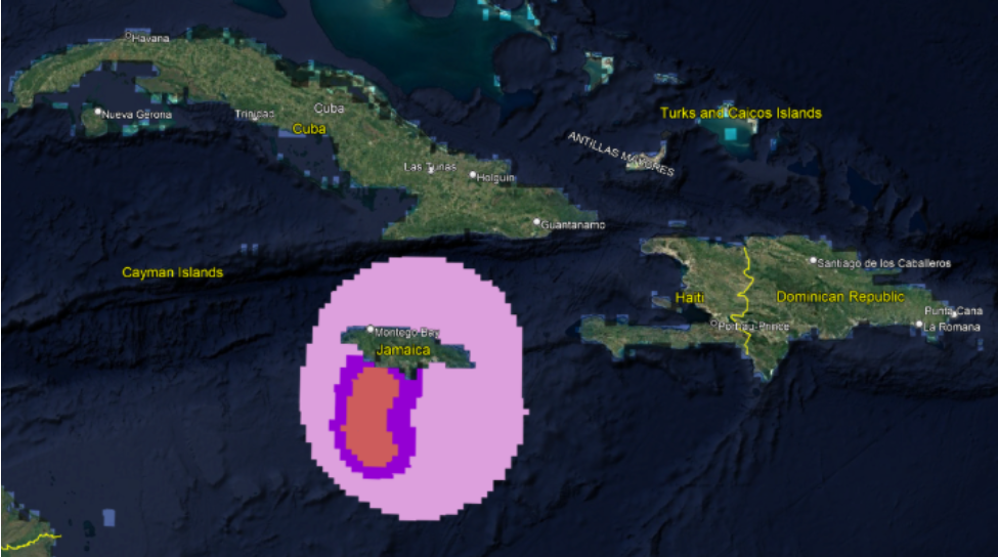
The wind bands are shown by the three colors and are at 34-47 knots, 48-73 knots, and 64 knots or greater. This is available on a separate site and uses GIS format designed to display on a chartplotter or ship’s ECDIS service. There are ways to display this information on a laptop but it requires specialist software. Currently this is experimental and unfortunately to see it you have to download the data in a compatible format (such as .S57, .bsb, or .mbtiles) from the NOAA GIS Data & Services portal and load it onto your device via an SD card.
Commercial ships will have this setup already but unless you are a tech nerd I think most of us will have to wait until it is available in a more general format, hopefully next season. If you want to look at accessing this service details are here.
Access is also improving with an updated website here https://www.nhc.noaa.gov/mobile/. Also Facebook here http://www.facebook.com/NWSNHC and will be doing live-streams on YouTube during storms.
Feel free to add to the discussion in the comments.