

We all want a crystal ball that tells us exactly what we will be in for during a passage, however long or short it might be. Personally, the main thing I care about is not the wind—I can sail in almost any wind. It’s the sea state that will end a cruise early. A rough, confused sea knocks crews down with sickness or injury and makes cooking, using the head, and even moving around the cabin difficult and dangerous. In my opinion, the sea state is the thing that should get your attention during weather planning.
So how do we find out what’s coming before the sky turns dark gray and the waves start coming aboard? To answer that question you need more than a pretty color wind map on your tablet. You need a forecast that tells you wave height and, more importantly, wave period, plus the position and track of storm centers and fronts.
In my early sailing days, we turned on the radio at the right time and listen to the forecast. On the BBC I would hear: “Fisher Dogger German bight, NW 4 to 5, backing westerly 6 by dawn.” Then the BBC theme song “Sailing By,” the national anthem and shut down. Now you can download a GRIB file instantly via Starlink. However, whether you pull a GRIB file over Starlink in a few seconds or wait fifteen minutes for it over Iridium or SSB email, you’re looking at the same raw model output. Faster downloads don’t change its blind spots: GRIBs don’t clearly mark fronts, and they don’t replace a professional forecaster’s judgment.
What Do You Actually Need From a Forecast?
You need to choose the right kind of forecast depending on what kind of sailing you’re doing. For example, I need to know what is coming today if I am sailing coastal, but if I’m sailing offshore, I need the forecast for the next two or three days. Why the difference in time frames? In coastal waters I will be within about a six-hour sail of some shelter in a harbor or bay. If the weather looks like it will become something I don’t want to sail in, all I need is enough warning to get to that shelter.
Offshore is a bit different, if I want to avoid an oncoming storm and there is no shelter to head for, I might want to sail around it. Doing that can mean moving a hundred miles or more and it may take a day or so to get far enough to make a difference. If I can’t avoid it, I am going to have to sail through it and I want time to prepare for that while the sea state makes that reasonable.
Sea State: Why Wave Period Matters More Than Height
Wave height is the distance from crest to trough and, within reason, does not matter much. Huh? You don’t care how big the waves are? No, not really. What I care about is how steep they are. I have slept soundly in 50-ft. seas that felt like going gently up and down in an elevator for several minutes at a time. By contrast, one of the few times I have called for help was when I got stuck in a tide race with wind astern at 30 knots and tide ahead at four knots and building. The wave crests were breaking over the stern and we were accelerating out of control down the wave fronts desperately trying not to broach and roll. The waves looked 20-feet high, but were probably really only about 15.
Think of it like the grade markers on the road. If a sign says 10% you may need to downshift your gears. If it says 20% you’ll need to slow down and check your brakes. If it says 35% you better be in a good 4×4! Waves are the same. If the wave period is two-and-a-half to three times the wave height, it does not matter if that is 30 feet with a period of 75 seconds, or five feet with a period of 12 seconds both. It will be smooth sailing. On the other hand, a six-foot chop with a period of eight seconds will have everything not strapped down flying around, including the crew. It will also stop most boats dead in their tracks.
Storm Centers, Fronts, and What They Mean
Storm centers and tracks are pretty obvious. What I want to know is, how bad is it and is it coming for me or passing me by? What I do about it depends a lot on the boat and crew. A charter crew on an untried boat may want to head for cover in anything over 25 knots. An experienced crew in a well-found and tried offshore cruiser may not be worried by anything under 40 knots.
Weather Fronts
These are the ones that get the pulse going. It may not last long but they bring squalls, sudden wind shifts, rapid changes in wind strength and steep confused seas. I definitely want to know if one is coming my way.
Reading Sea States in GRIBs
Now that you know what to look for, where do you find that information? Let’s look at the same Gulf of Alaska conditions through two different lenses.
The GRIB Approach:
Chart 1A. A typical GRIB file display taken from the Gulf of Alaska.
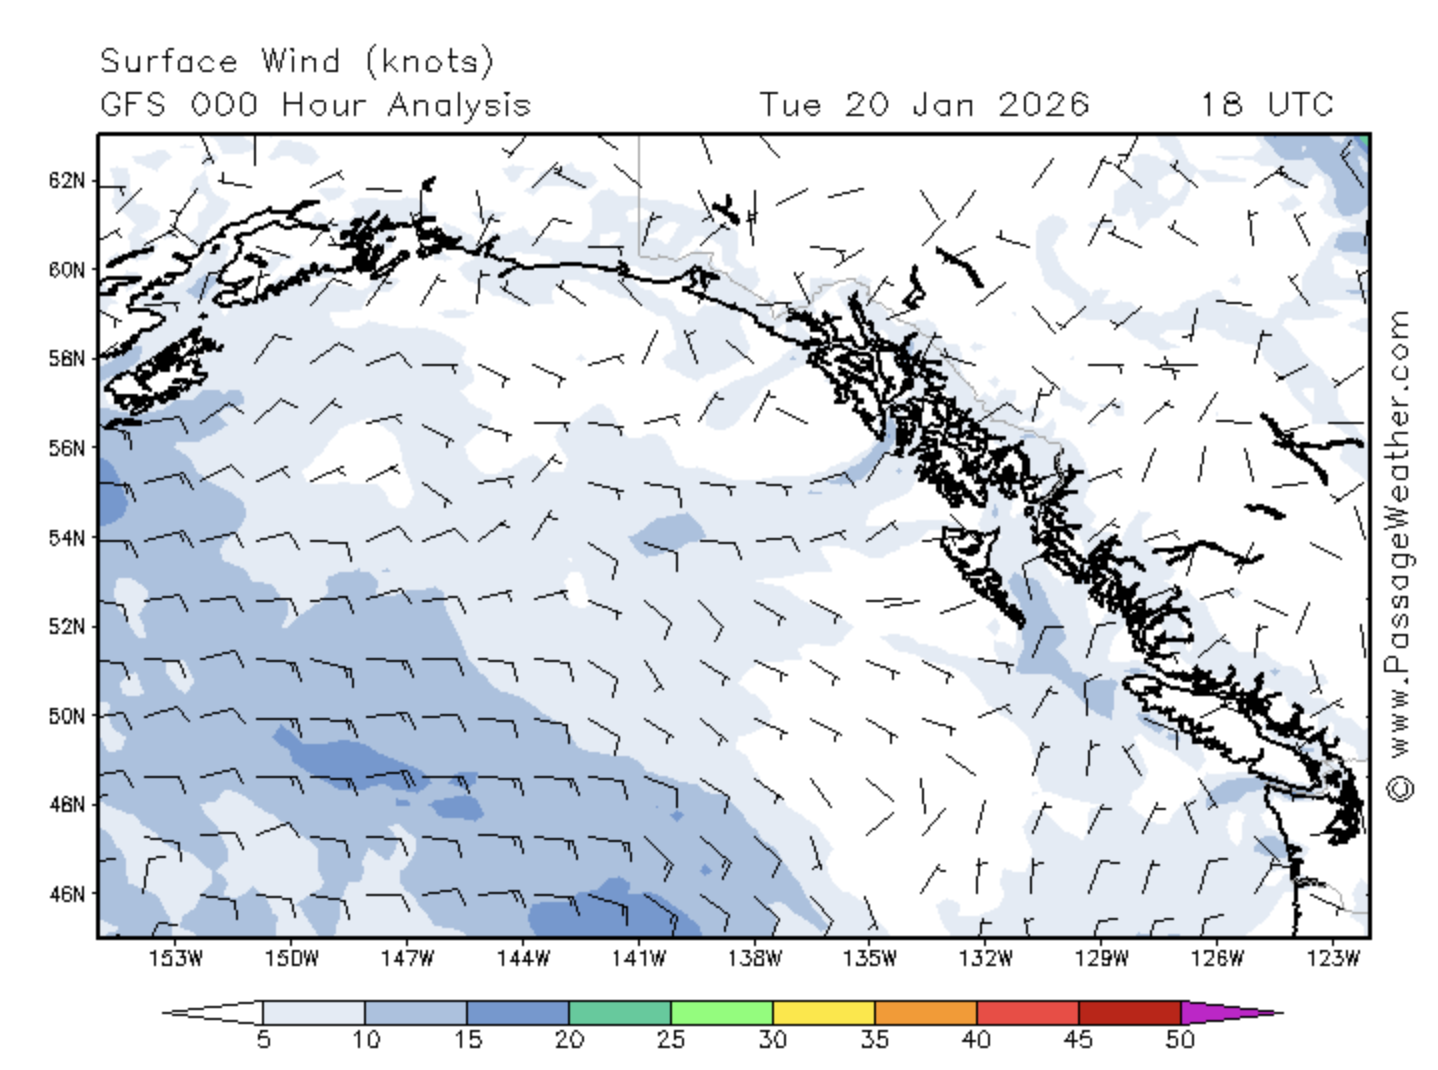
Chart 1A is the surface wind from the GFS model. You can see a complex pressure pattern over the Pacific Northwest: a low-pressure system offshore of British Columbia with moderate winds wrapping around it. Most of the domain shows light to moderate winds in the 10–20 kn range, with a few pockets where winds exceed 20 kn near the low-pressure center.
To see what the sea state will look like under those winds, reference the wave chart from the same program:
Chart 1B. Wave height and direction
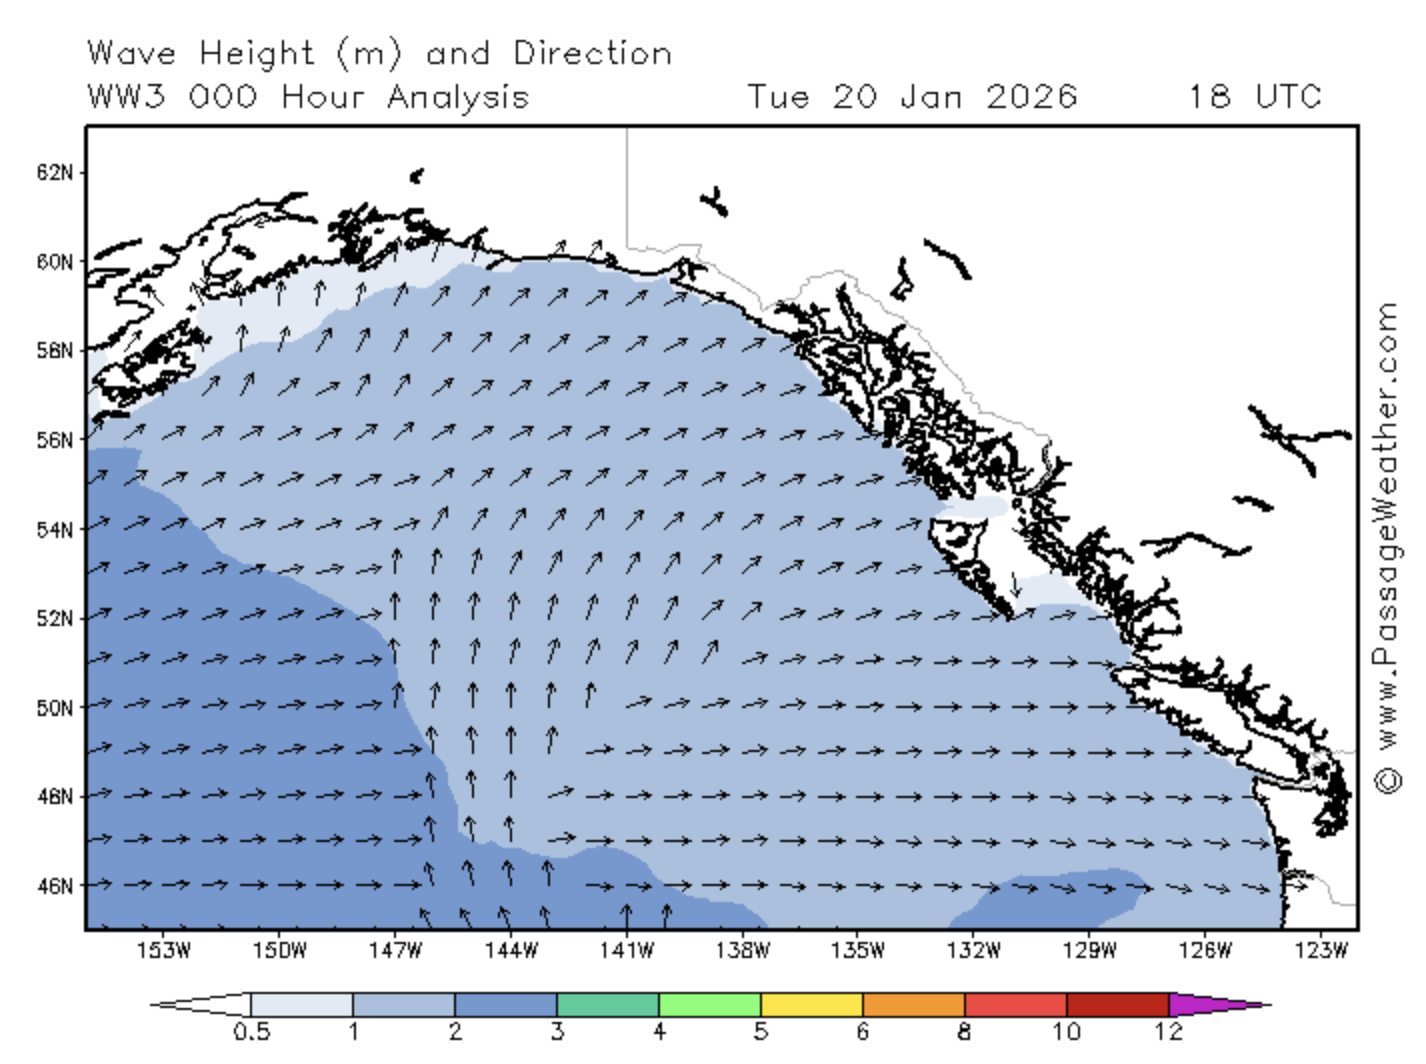
Chart 1B adds wave height and direction from the wave model. In this case the picture is fairly benign: most of the offshore Gulf is running 2–3 m (6–10 ft.) of northwest swell, all in roughly the same direction. If you stopped there, you might conclude that conditions are manageable and stay focused on your immediate patch of ocean.
Here’s the thing about GRIBs: whether you pull one over Starlink in a few seconds or waited fifteen minutes for it over Iridium or SSB email, you’re looking at the same raw model output. Faster downloads don’t change its limitations. GRIBs don’t clearly mark fronts with symbols, and they don’t carry a professional forecaster’s judgment about what the model might be missing.
What the Pros Add: NWS and Professional Charts:
Now compare these GRIB files to a weather map produced by a professional forecaster:
Chart 2A. Surface Conditions from NWS
Storm centers are clearly marked, and, from the isobars, it is fairly easy to see the wind speeds and direction, as well as sudden changes. If you are not familiar with these charts you may need a key to what the symbols mean, but it is not complicated. Storm tracks are not marked but forecasts are updated every six hours, so it is easy to work out track by comparing charts from different time periods.
Chart 2B. This is the accompanying chart with wave height and direction.
These two sets of charts are derived from the same basic data, but are presented in very different ways. They will require some investment if you are going to download them onboard and learn to read them effectively. Why would you choose one over the other?
The first, and to my mind, most important difference is that the second set are produced by a team of professional forecasters who know the area and how the weather in their area tends to behave in that zone. They are produced and distributed by the U.S. National Weather Service and supplied to both the Navy and professional mariners. That gives me lots of confidence.
The first maps are simply raw data and it is up to you to interpret them. They are not produced by any official weather service so in effect their only credentials are whether you trust the site. I may know a fair bit about weather, but I am by no means a meteorologist. Am I going to trust my judgment against a professional weather forecaster with years of training and experience?
Professional Forecasts: Text and Charts
The last thing I want to look at before we get to where to get weather charts is the traditional text forecast. It is still available and very useful, especially for coastal sailing.
This is what the UK coastal Navtex report looks like, but all maritime authorities produce similar forecasts for their waters.
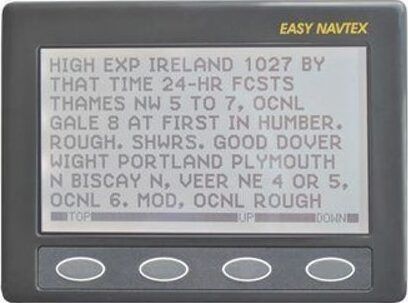
Again they are updated every six hours and unlike listening to the radio you don’t miss the forecast because you were putting a reef in or landing a fish.
Conclusion
Hopefully by now I have at least piqued your interest in the professional maritime weather services available, and made a case for considering them as an alternative to Uncle Google. So why do so many people seem to automatically head to the internet for weather reports? I think the answer is simply familiarity. We are all, me included, so used to heading for the computer if we want to know anything it often does not occur to us that they may be other, possibly better, sources of information.
Charts 1A and 2A in this example come from a weather-fax service. You can use any SSB receiver connected to a computer to display and save the charts. But if you don’t already have SSB on board, or even if you simply want a dedicated receiver that is only used for weather, the same company offers a unit for $355. You don’t even need a fancy backstay aerial. So total cost can be less than $1,000 and zero running costs. How does that compare to satellite internet? A word of warning on reception. SSB is generally good worldwide when at sea, but I have seen some people install a new setup and think they have done something wrong because they cannot get a signal when they test it in harbor. The answer is simply that the signal is being grounded by all the surrounding masts. Use the internet in harbor and SSB at sea. (You can log into Wfax stations via the internet and download the same charts. NAVTEX is usually okay in harbor.)
All NOAA and Navtex forecasts are free. The easy Navtex receiver illustrated costs $585 but there are several other options, many costing half that much if you want a module to plug into the computer rather than having its own screen. In 2024, the National Weather Service phased in a new wave component detail that highlights wave height, period and direction.
Resources:
- NOAA NWS Marine Weather Forecasts
- Radiofax Charts – Kodiak, AK
- Worldwide Met-Ocean Information and Warning Service (WWMIWS)
- NAVTEX
- Wfax
- Be sure to check out NOAA’s “Wave Detail Overview” YouTube video:
This article was published on 12 March 2024 and has been updated.


This is the best explanation of weather data needed I have ever read.
Very good. I remember visiting the NWS office in Honolulu in 2010, fresh off a passage from the PNW. Giant screens all around displaying weather charts and grib data from the arctic to below the equator. “What’s in the red booth?” I asked. Oh, that’s the tsunami hot line! One meteorologist asked “I am preparing the wave height and period forecast. It seems pointless.” I reassured him: That particular chart and its information is critical. More so than wind. Wave period is critical to small boats. Keep it coming.
Thanks for the article.
Excellent reading. I’d like to suggest that the images be clickable so we can see them larger in a separate window, it would be really helpful in trying to follow what’s being explained in the article.