

Over the last few decades, there’s been exponential growth in the availability of accurate weather forecasts and the net result is safer voyaging.
Government spending on weather data gathering and forecast development has soared. Satellites and data buoys have filled in some of the oceanic gaps caused by an absence of weather balloon sampling at sea. State of the art, algorithm-driven, model data and ensemble-based forecasting have turned electronic guesswork into a better understanding of atmospheric volatility. The net result is an increase in the validity and reliability of marine forecasts and a trend that has stretched 24-hour forecast accuracy into 48- and 96-hour time frames. So, if anything deserves the label don’t leave homeport without it, it is todays, better than ever, marine weather forecast.

This close-up look at the acquisition of weather info takes a multi-track approach. In many ways, it mirrors how boat maintenance can be carried out. On one hand, there’s the 100-percent do-it-yourselfer approach and at the other extreme there’s the let the pros do it all. Todays DIY sailor/amateur forecaster, like the pros, continue to put a lot of faith in barometric trends, cloud cover, wind direction and sea state. Both also have a chance to tap into National Weather Service (NWS) graphical and text data via cellular, sat phone, and single-side band (SSB) connectivity. In short, the savvy sailor/onboard forecaster can leverage an immense amount of information if they learn how to read the weather maps provided by the National Weather Services Ocean Prediction Center (OPC), National Hurricane Center (NHC) and the Storm Prediction Center (SPC).
For decades, weather routing services have been important to commercial mariners, and today more and more racers and cruisers are opting for their concierge forecasts-a product that’s fine-tuned to a sailors specific needs. In between the service of a pro weather router and the I’m on my own approach to understanding the atmosphere are a majority of sailors who put some weather training and communications equipment to good use. In addition to regularly listening to the VHF weather channels, they use smartphone and tablet connectivity to access web-based NWS forecasts. Many sailors subscribe to services that provide gridded binary (GRIB) files, compressed files of weather information that can be displayed on phones, tablets, or networked multifunction displays (MFDs). Many of these FM based satellite broadcasts yield graphic displays of wind speed/direction, highs and lows, isobars, surface currents and other valuable data. The FM service extends beyond VHF and cellular coverage, but drops off at about 80 to 100 miles from shore.
Beyond this point weather forecasts are available via high-frequency radio or a variety of satellite links. Both of these technologies suffer from low baud rate but a growing number of companies offer software to unlock compressed forecast data. A good example is OCENS GRIB Explorer (www.ocens.com) that links phones, tablets or a PC to a low earth orbit sat phone connection (Iridium, Globalstar, Inmarsat) and delivers sizable amounts of GRIB data in a relatively short period of time.
Slow, quirky but still quite reliable; SSB high frequency radio continues to afford free access to OPC and other valuable marine weather info sources around the world. It remains a viable alternative and downloading data is free of charge. The technology requires a Pactor II modem, laptop computer and some decoding software, plus some radio and antenna installation and operation know how. There are also high seas voice broadcasts and text info transmitted by the U.S. Coast Guard. However, the ease of use and the 24/7 reliability of a satellite link has caused many to opt for a LEO satphone and a GRIB reader.
The Router
We have also noted a growing number of offshore sailors turning to customized forecasts and weather routing as their primary means of staying in sync with an ever-changing atmosphere. Last summer, PS Technical Editor, Ralph Naranjo was aboard a Holland America ship in the Gulf of Alaska and visited the bridge to see how navigation and weather routing was being handled in the big leagues. During his interview with deck officers aboard the Noordham he noted how the crew acquired daily weather guidance from Weather Routing Inc. (WRI), a private sector marine weather forecaster based in Glens Falls, New York. Scrolling down the ships ECDIS display screen, he read over what turned out to be a spot-on four-day forecast for the always volatile Gulf of Alaska. He noted that other vessels in the Holland America fleet were spread from the Med to Tasmania and all were being weather advised from the same office in upstate New York.
Later in the fall, at a Cruisers University session in Annapolis, MD, Jeremy Davis, a meteorologist and operations manager for WRI, was lecturing about how global forecasts were developed. Naranjo arranged to visit WRI headquarters in upstate New York, and see for himself how they tracked weather for clients scattered around the globe.
For over 50 years WRI has functioned as a commercial marine weather routing business. Today, its staffed with 28 degree-holding meteorologists. Their home base is a recently renovated, brick edifice that once housed a high-end carriage building factory. The restored ornate hardwood floors stand in stark contrast to cutting edge computer technology and well focused lighting. Forecasters sit at comfortable work stations surrounded by glowing monitors that act like a microscope aimed at the atmosphere. Its a pleasant place to work, and forecasters have developed proprietary software with which they customized forecasts.
Company President, Stasu Bizzarro stressed that a key part of each meteorologists role lies in developing clear, unambiguous weather guidance that makes routing and go/no go departure decisions more discernible to a lay person. He also underscored the value added factor that’s gained by inserting a meteorologist into a stream of GRIB data, and how WRI fine tunes model based forecast information to deliver specific guidance to their clients. Meteorologists provide location-specific weather maps and plain text and or verbal descriptions of what these maps depict to each vessel and crew. Included in this boat-specific forecast is a profile of the wind and sea state changes over the forecast period and what key factors are in play. They also understand the difference in communication capability between large ships with Inmarsat A and Fleet Broadband terminals, and small sailboats with an SSB and a LEO satellite handheld phone. In addition, WRI produces Sea Weather online (www.seaweather.net), a subscription service that provides digital model based wind/wave data, tropical weather reports, voyage planning info, and much more.
The big upside in such a weather-for-hire relationship is the 24/7/365 access to a professional, credentialed meteorologist-a person whose day job is forecasting weather and whose been educated in the nuances of atmospheric science. The second big plus lies in the customized, boat/crew specific info developed for each customer. By knowing whether youre seeking the fastest route, smoothest seas, or an itinerary to avoid stormier seasons in each ocean basin, a router can develop a specific game plan for each client. And the third big plus is access to a forecaster, just in case what’s transpiring at sea contradicts what’s in the forecast.
Another key factor is the question of what happens when and if communications fail. There’s value in developing your own independent weather awareness. In the case of WRI, they add forecast delivery redundancy with a large staff, multiple access to online data, their own backup generator to hedge against power loss. They encourage their clients to have more than one way to receive WRI forecast information. One of the reasons WRI meteorologists make use of simple, clearly written, text descriptions of each forecast is that they are easy to transmit, even on low baud rate LEO sat phones and SSB/Pactor II systems like Sail Mail. Those with faster baud rate sat systems can tap into plenty of weather map enhancement when their data handling capacity is in place.
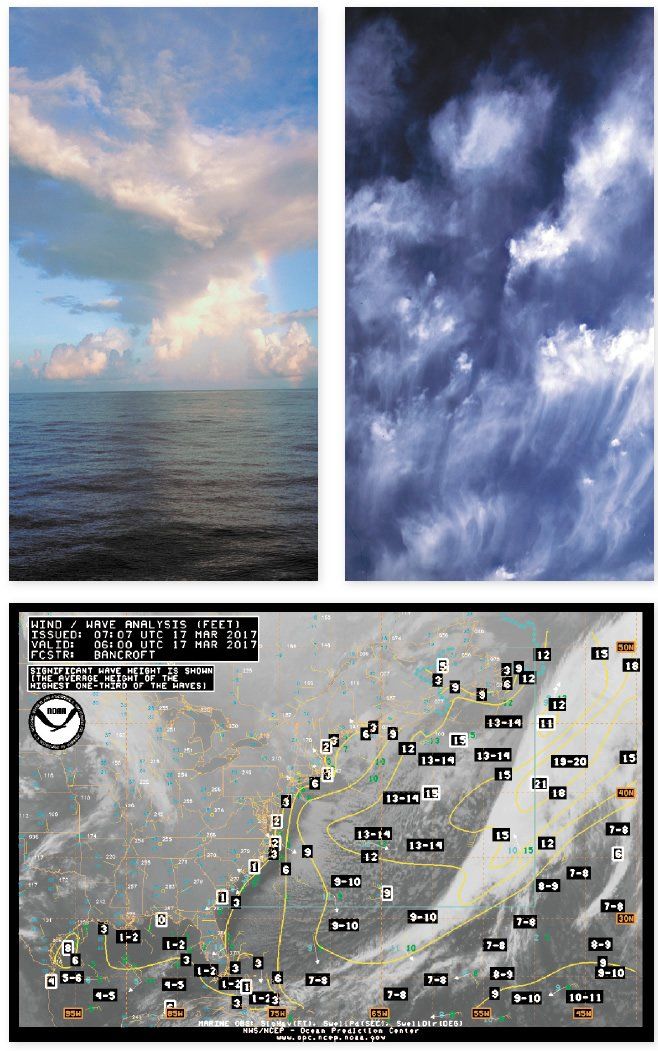
The bottom line, however, is the client is out at sea while the forecaster is in a remote location; thus, communication technology becomes paramount. As the barometer plummets and the seaspray begins to fly, antennas may not fare so well and communications can suffer. Those who have used their concierge forecast service to develop their own weather awareness, and are in better shape if communications falters. In such a case, the sailor who is able to bring his own knowledge into decision-making will have a ready backup plan. For example, if a crew sailing east bound at 40 N notes a dramatic build-up of cumulonimbus clouds to the west, observes a rapidly falling barometer with a veering wind (increasing as it moves from SSE to SW), its a pretty likely that they are about to be overtaken by a volatile cold front. These frontal passages are worse in the early spring and late fall and can deliver gale force of higher winds as the southwesterly abruptly turns west-northwesterly. Knowing such basics, may not replace your weather router, but it can prove to be a very useful if a backup plan is needed.
The cost of such custom forecast service depends upon how often and how detailed a consultation is required. WRI offers prospective clients a rate sheet with specific prices for verbal reports, written reports (or both) plus weather maps. A look at the custom forecast industry revealed a ballpark range of $60 to $130 per forecast for such services. WRIs rates fall in the midrange of these numbers. They also offer a digital weather GRIB service via SeaWeather online for $50 per month (basic plan) to $80 per month (premium).
Government Help
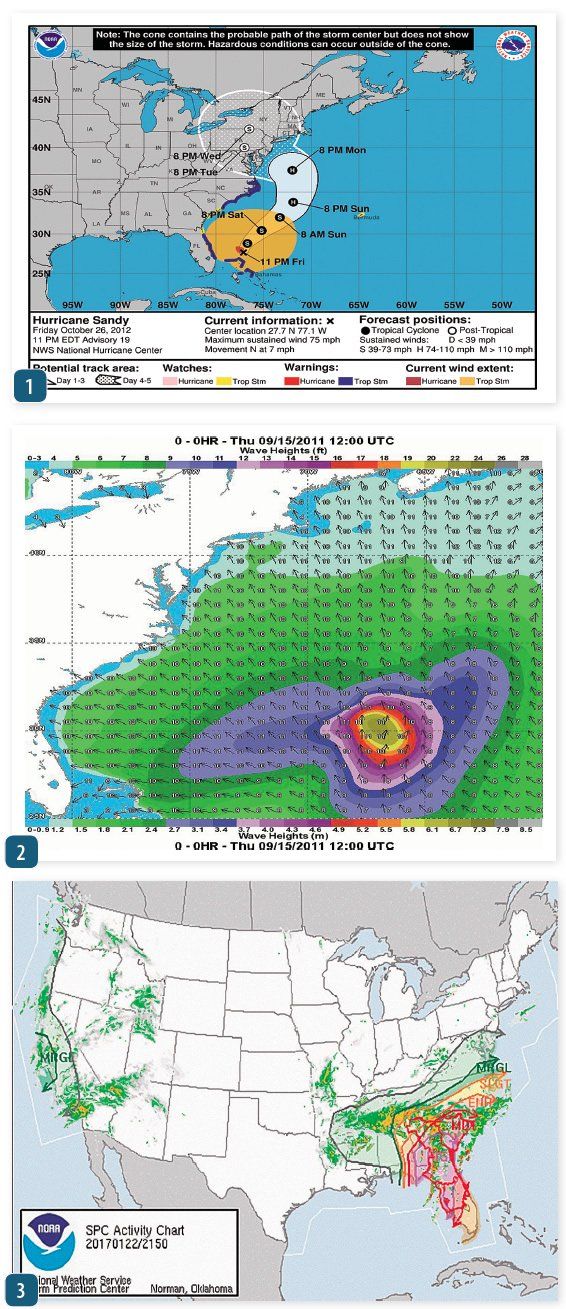
Marine weather forecasting has been divvied up, and governments around the world have been assigned specific ocean basin segment. Not surprisingly, the U.S. has been given a big piece of the Atlantic and Pacific, and its doing a great job of forecasting fair weather and fierce storms. The National Weather Service (NWS) is a valuable resource that resides under NOAAs big umbrella. The NWS has set up the Ocean Prediction Center (OPC), National Hurricane Center (NHC) to produce forecasts for a sizable part of the globe. Each has a website that offers an abundance of data along with tutorials guiding users and historical vignettes that can turn the casually curious into more weather aware sailors. The OPC analysis for each ocean sector is a graphic summary of near real time observed and measured weather conditions, while their forecasts are detailed projections (24-48-96 hour) detailing what is highly likely to occur in the near-term.
The OPC has become the data-gathering, forecast foundation for many meteorologists and weather routers. They are also the go-to hub for sailors engaged in DIY weather awareness. The focal point of what they offer on their website appears as three rows and three columns of weather forecast maps. Listed from left to right, they cover 24-, 48- and 96-hour forecasts. The short range 24-hour is the most accurate, but in the last decade or so, thanks to refined scatterometer (satellite sea surface sensing) and better modeling, the 48- and even 96-hour forecast have grown quite reliable.
Those new to using a weather map should go directly to the surface analysis on the OPCs Atlantic or Pacific webpage (www.opc.ncep.noaa.gov/). These are surface forecasts and depict the location of high and low pressure systems in terms of lines of equal pressure-isobars. The closer the lines, the steeper the pressure gradient and the stronger the wind will be. Warm and cold fronts are linked to temperate region low pressure systems while tropical lows that develop into disturbances-depressions-tropical storms and hurricanes are the territory of National Hurricane Center (NHC), another subset of the National Weather Service and a source with its own website.
The bottom row of the three OPC weather maps is designated wind/wave, and its the easiest to understand. Note the title block on each map, a feature that tells you when the map was issued and the date and time of its validity. It also defines wave height data in terms of significant wave height (the average of largest one-third of waves). Oceanographers have noted that over a 24-hour period, one should expect a wave that’s twice the significant height. And in anomalous regions, such as in the Gulf Stream during a nor’easter, waves up to three times the significant wave height can be encountered. When checking wave forecasts, note that the 24-hour map is in feet and the 48 and 96 hour maps are in meters-assuming that the numeral 8 means eight feet when it may really indicates 8 meters is a mistake with memorable implications.
Finally, the top row (500Mb charts) profiles the mid-level of the atmosphere. These maps are less intuitive and sailors need to study a bit of Weather 101 before attempting to put the data to good use. The lines on these maps are isoheights depicting the altitude where the barometer would read a consistent 500Mb. Wind barbs show the direction and speed of upper level west to east zonal flow and more north and south meridional flow. The effect of troughs and blocking ridges and cut off lows greatly influence the intensity of weather on the surface and help define how the surface low will move. Learning how to interpret the influence of the mid level of the atmosphere is worth the time it takes to fully understand the 500 Mb Chart. Lee Chesneaus book Heavy Weather Avoidance and Route Design affords a definitive look at how the mid-level of the atmosphere influences surface lows and what a sailor can glean from OPC 500Mb weather maps.

During Hurricane season, the NHC provides early warning of the possible development of a tropical storm or hurricane. Their use of text and graphic commentary springs into action as soon as a suspicious looking cluster of thunder storms begins to intensify and shows signs of any rotation. This alert is well ahead of when such tropical lows are classified a tropical storm or hurricane. By adding the labels tropical disturbance and the more organized tropical depression to the mix, sailors get a preview of potential development and the track the systems are initially following.
In addition to the NHC observing these disturbances taking shape on easterly waves (a short lived shift in the easterly trade winds), they are tracking what’s going on in the wider atmosphere across both the Atlantic and Pacific tropical regions. Moisture, sea surface temperature, wind shear, prevailing surface flows, and upper level troughs and ridges all influence whether or not tropical storm development is likely, where its headed and how intense it will become.
The sailor doesn’t need to duplicate the forecasters job, but he or she does need to know how to read and respond to the data available in an analysis or forecasts. One can think of the SPC forecast as a game of Blackjack in which there’s now a video display of the dealer’s hand. The variables have been reduced to the random nature of the deck itself (atmosphere) and card counting is OK.
Ralph Naranjo, the former Vanderstarr Chair at the U.S. Naval Academy, is Practical Sailors technical editor. He is the author of The Art of Seamanship, available our online bookstore at www.practical-sailor.com.
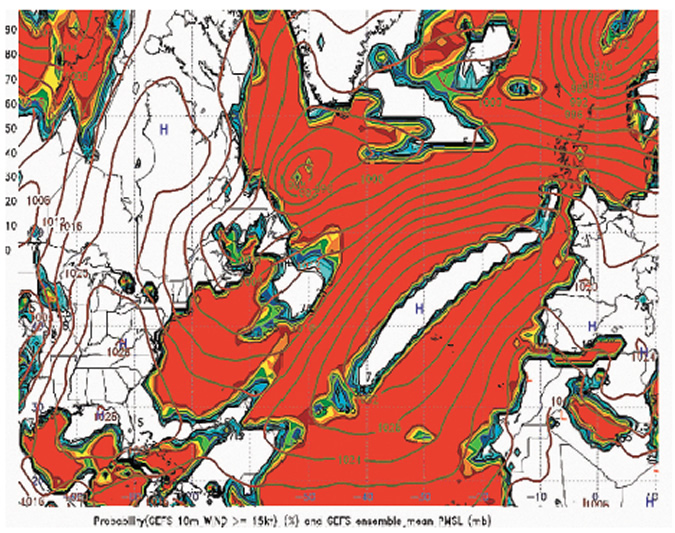
The Ocean Prediction Center is developing useful probabilistic forecast products that can be displayed as informative map graphics. The bright red colored regions on the adjacent chart indicates regions where the sustained wind velocity has a 90 percent probability of being 15 knots or greater. Other shades of color indicate lower probability of the current conditions being 15 knots or greater. There are also two other similar charts, one indicative of the probability of 25 knot or great wind speeds and the third in the set denotes regions are likely to have 35 knot or greater conditions.
The charts are generated using model data derived from GFS ensemble runs – a statistical process that compares likely deviations from model assumptions and delivers a midrange solution. These forecasts differ from more traditional deterministic weather reports by the addition of a percentage based “how likely” component.
These maps also display the location of high and low pressure centers and include isobars with the usual 4 millibar spacing. A user in the northern hemisphere can determine wind direction by recognizing that wind flows counterclockwise around lows and curve inward and diverge from the isobars at about 20 degrees. Around highs, wind flows clockwise at a 20 degree outward deviation to the isobars.


I am surprised you didn’t mention Chris Parker’s Marine Weather Center. I cruised the US East Coast, Bahamas and Caribbean, all the way to Trinidad and back for two-and-a-half years, and Chris’ weather forecasting and routing recommendations were instrumental in keeping us safe.
What app(s) do you recommend for day sailors and local cruisers re weather and wind forecasts? Thank you.
Particularly irritating is that more than 15 nautical miles from the largest coast guard in the world at Kodiak, radio weather reports are unavailable. The north, south and west coasts of Kodiak Island are dead zones with regard to VHF and SSB broadcasts. The USCG website claims they broadcast two weather reports daily on SSB on 6.501 MHz at 0745(L) hrs and 1730(L) hrs. Do not depend on that happening. After having sailed virtually all south central and southeast Kodiak waters I have yet to reliably receive readable 6.501 broadcasts. Likewise at my home in Anchorage. My point is that regardless of what the USCG publishes do not really on them for weather information.
About fifteen years ago the USCG broadcast a daily interactive SSB weather report on 4.125 MHz at 0730 hrs (AST). It was interactive because the announcer gave a report for a particular area and then invited comments. Fishermen in that area would then report in real time on what was happening in that area. It was by far the best weather reporting available in Alaska. But, alas, that broadcast is no more replaced with NOAA recorded VHF reports and unreliable 6.501 SSB.