

Benjamin Franklin is credited with the quote “the weatherwise and the otherwise.” It remains savvy advice for all sailors, and thanks to modern oceanographic and atmospheric science, becoming one of the “weather wise” is easier than ever before.
Today’s forecasts are available in text, voice, and graphic formats. They can be enhanced by a forecaster’s practiced eye, or be derived as a computer-generated, gridded binary (GRIB) file (see “Getting Weather at Sea,” PS April 2020). Both are available free of charge from the National Weather Service (NWS).
In addition to the free products from NWS, there are third-party products and broadcast services such as Sirius XM and Theyr. For ocean voyagers and passagemakers looking for personal weather consultation, there are professional weather routing services such as Weather Routing Inc. and Commanders’ Weather. These sources use a wide array of detailed surface and mid-level atmospheric data to make forecasting accuracy far better than it was just a decade ago.
Which resources to tap depends upon your weather awareness and your need and desire for details. The weekend sailor might be satisfied getting severe thunderstorm avoidance strategy on traditional VHF weather watches and warnings, while the ocean voyager/amateur meteorologist might be interested a full Skew-T chart, a complex chart used to illustrate weather trends using temperature, dew point, wind speeds, and more.
Most agree that there’s a big difference between a newspaper weather map and a 500 mb weather forecast. The former lets you know whether to bring an umbrella to work, and the latter can tell you a lot about how an approaching surface low will behave, where it’s headed and the likelihood of major intensification.
For many, the latter may seem way too arcane. But if you want to join Franklin’s cognoscenti, a bit of time spent perusing the NWS websites will help you learn how to analyze 500mb maps, decode Skew-T charts and translate the symbols used in every Surface Analysis and Forecast. In short, giant advances have been made in forecasting and it is worth the effort for sailors to learn to make the most of them.
NOAA UPGRADES
The weather may not be getting any better, but marine forecasting has taken a big leap forward. NOAA’s latest upgrade has been a major tweak to its signature Global Forecast System (GFS). Their primary numerical model has undergone a sea change, one that promises to improve forecast accuracy by adding much more vital data to the predictive puzzle. The new approach includes merging the GFS model with the wave model WaveWatchIII.
The net result of this change is a doubling of resolution, more use of satellite data and the inclusion of flight level aircraft wind, temperature, and dew point measurements. These efforts will help fill in the gap left by the absence of twice daily weather balloon launches that occur over land but not over oceans.
In 2019 NOAA’s Dynamical Core Team made major changes to the GFS weather model. It was the first big makeover in decades and the new Finite Volume Cubed Sphere (FV3) model improved the computation of air pressure and wind fields.
Dr. Uccellini, director of NOAA’s National Weather Service described the 2019 work, “as a complete engine replacement” and the recent introduction of the GFSv16 upgrade, “as a major boost in horsepower.” The bottom line is that the pathway to more accurate forecasts and longer-range projections hinges on more data and smaller sampling grids. In just a couple of years, climate modeling has gone from 60 -120 mile grids to 2-3 mile grids.

Supercomputing allows the added data to be handled more efficiently, and both weather forecasters and climate scientists welcome the upgrade. However, the major beneficiaries will be commercial mariners, sailors and powerboaters.
Dr. S.J. Lin, codeveloper of the Lin- Rood Shallow Water Algorithm and leader of the FV3 model development team, divided the earth into cell-like cubes. It expedited fluid dynamic calculations that deliver accurate pressure and wind statistics in each cube. Previously his modeling efforts successfully defined how chemicals moved in the upper atmosphere influencing Ozone. Now his model development is aimed at the dynamics of low and midlevel portions of the atmosphere and how to improve weather data validity and reliability.

A byproduct of this increase in model resolution is said to be a 10-15 percent improvement in hurricane forecast accuracy. Another, is a major stride forward in long-range, ocean wave prediction capability, that can reach out up to 16 days in advance
These upgrades come on the heels of an FV3 tune-up to another model, the Global Ensemble Forecast System (GEFS). It’s all part of NOAA’s global forecast efforts and their Unified Forecast System framework. They are focused on improving weather models whose vulnerabilities became evident in the wake of Hurricane Sandy. Drastic disagreement among models, just a few days before Sandy’s landfall, put ground zero at locations that ranged from Maryland to Maine. Since then, collaborative efforts and a major uptick in Cray computing capacity have improved modeling outcomes.
TEMPERATE ZONE MYSTERIES
In the temperate zone (23°- 66° latitude), today’s weather is seldom the same as tomorrow’s forecast. In these latitudes, westerly winds and cold core low pressure systems move in an easterly direction. Gales and storms in this area are linked to the most volatile versions of these low pressure systems. This is why Beaufort linked wind velocity to wave height in his revered Beaufort Scale.
Thanks to advances in electronic data gathering, satellite sampling, modeling precision, and forecast development, meteorologists have made great strides in predicting how weather systems and sea states evolve over time. And by developing an understanding of how to use the Ocean Prediction Center’s (OPC) 24-, 48-, 72- and 96-hour forecasts, a sailor can optimize cruise plans or fine tune racing tactics. The knowledge also plays a key role when it comes time to evaluate a “safe haven” whether it be an anchorage, mooring field, marina, or hurricane hole.
These OPC forecasts are derived from a combination of computer model runs, direct observation and the intense scrutiny of a team of meteorologists. The latter are the gatekeepers of machine forecasts and their “expert’s eye” function keeps model anomalies from sending forecasts off course.
At some point in the future artificial intelligence (AI) may be able to handle it all, but at the moment, experienced forecasters play an essential role. They make significant use of model derived data, but they also know which model to trust under each specific condition. This value-added feature, provided by the Ocean Prediction Center team, other National Weather Service forecasters, and reputable independent forecasters, is a better bet than simply using raw model data from a single source as your stand-alone forecast.
Even the best forecasters recognize the old fish factor that’s associated with an aging weather forecast. Today, we hear a lot about 7-, 10-, 16-day and even longer forecasts, but no one says much about the accuracy linked to these longer looks toward the future. One thing is certain, you can bet on the accuracy of a current weather analysis. These analyses are based upon data gathered from ship reports and balloon launches, buoy reports, satellite info, etc.
Next in reliability is the 24 hour forecast. The 24-hour forecasts projects what had been measured and sampled into a day-from-now look at where the systems have moved and whether they have weakened or strengthened.
Obviously, weather is not wine, and the aging process works against the quality of a forecast. But with improved computing capability and better sampling of the atmosphere, the 3 -day forecast, that once seemed like it was modeled on a ouija board, now comes close to matching the accuracy of a 24 hour forecast. The 3-day overthe- horizon view helps sailors plan a cruise or plot a route across the Gulf Stream. However, the increase in long range forecast accuracy doesn’t mean you only need to download forecasts every few days. The old fish rule is still in play.
Regularly acquiring forecasts is only the first step. The real art lies in being able to decode the symbols and recognize what they mean in the context of wind and sea conditions. And by understanding the lingua franca of a weather map symbology, a coastal cruiser will be better equipped to dodge or handle a summer line squall, and those approaching the Gulf Stream learn to recognize weather to steer toward or to avoid. When bad weather appears in a long-range forecast, it often gives a cruising sailor an early enough warning to move to safer shelter and avoid getting pinned down in an unprotected anchorage with a hungry lee shore. Weather maps and products provide several ways to discover what you’re looking at.
DEVELOPING WEATHER AWARENESS
Gathering weather information is just the start. Decoding these weather products and using them to make smart routing decisions require more skill and effort. Forecasting is an art acquired through study and practice, but the essential knowledge is within reach of any sailor. The following provides details on how to develop the skills needed.
I prefer a three-pronged approach to building weather awareness. It’s best to begin with a dose of weather 101 from either a classroom course or via some DIY web-based learning. For starters, try the National Weather Service’s web site “JetStream—An Online School for Weather.” This provides a succinct, n tuition, no equations understanding of how heat from the sun and moisture in the atmosphere fuels weather. You’ll be introduced to how an ocean/atmosphere duet affects every sailor and sailboat. The program delivers a lay person’s awareness of how fluid dynamics and energy transfers cause high- and low-pressure systems to form, trade winds to blow and ocean currents to circulate.
For those looking for a round two of weather instruction, I recommend a more in-depth marine weather course tailored to sailors. It should focus on meteorological factors that directly affect sailors rather than more arcane meteorological details. A two-day program that includes a bit of climatology and oceanography makes sense.
Regional weather varies not just by latitude and the declination of the sun, but by ocean current and air mass influence. By developing a synoptic perspective— a big picture look at the interaction of surface highs and lows, you’ll set the stage for learning about the mid-level of the atmosphere and how it influences storms and high pressure systems.
Energy from the sun heats air molecules causing horizontal and vertical movement of air. The atmosphere is a giant thermodynamic interaction involving water changing state (gasliquid- solid) and wind belts moving storms in predictable directions. The atmosphere couples with the oceans and wind-driven surface currents help transferring heat from the equator to the polar regions.
Moisture content and temperature define air masses. Atmospheric pressure, designated by isobars, identifies areas of high and low pressure. Seasonal changes in weather patterns define climate, which in turn is linked to the location, movement, and development of high- and low-pressure systems. In the northern hemisphere, surface winds rotate clockwise around large oceanic highs, giving rise to major ocean surface currents. The Coriolis effect bends winds to the right in the northern hemisphere and to the left in the southern hemisphere and the net effect includes trade winds in the tropics and westerlies at higher latitudes.
In this big picture, wide-angle view of weather in the northern hemisphere, it’s easy to see how semi-stationary, mid ocean, high pressure systems develop easterly trade winds on their equatorial facing side while westerlies prevail over the northern portion. Wind and waves have a direct relationship—when the wind (velocity, fetch and duration) increases so does the wave height.
Fetch is the term that describes the distance over which a given wind event blows over a specific body of water. Some storms move faster than others and this too can influence wave size. The greater the fetch and the faster the storm moves, the larger the waves. Naturally, the higher the wind velocity and larger the radius of gale or storm, the larger the seas will become. As waves move away from the wind that creates them, they organize into swells with greater wave lengths and the period increases. Storms move from west to east along the polar side of the, clockwise rotating, high pressure cells (northern hemisphere) that are known as the Bermuda High, Azores High and Pacific High.
Low pressure systems are often created on the Polar Front, an interface between cold polar air and warm, moist tropical maritime air. These cold core lows usually incorporate both a warm and a cold front—each exhibiting distinct weather characteristics. Sailors quickly develop deep respect for the volatility of a cold front passage along with the foul weather encountered close to a low’s center. The former comes with volatile thunderstorm activity and in the northern hemisphere, a violent wind shift from SW to NW. Stronger lows are labeled with Gale, Storm or Hurricane force warnings.
The stronger the wind in the storm the larger the waves will become. But there are some additional factors that also play an important role.
Generally speaking, the lower the pressure, the stronger the wind. But a better measure of volatility is the gradient that exists between a nearby high and the center of the low. Moving a high and a low closer together, increases the gradient in much the same way that pushing contour lines together on a topographic map increases steepness.
Seldom is there only one weather event creating a sea state. Often, waves produced by distant storms in one part of an ocean basin interact with a storm close to the coast on the opposite side of an ocean basin. The net effect can be amplitude reinforcement resulting in extremely large, dangerous breaking seas. There are additional factors such as currents, shoals, headlands and river mouths that further exacerbate wave size and steepness. Breaking waves are a major hazard and can make inlets very dangerous even when the wind is light. The Ocean Prediction Center publishes 24, 48, 72, 96 hour wind wave and wave period Forecasts.
Exposure to a seaway is the key variable. In fair weather an anchorage near shore in a wide-open bay can be delightful. There’s just enough breeze to keep the bugs away and there’s almost no swell rolling in from the 180 degree or more exposure to open water. But, when the humidity is high and the late afternoon sky is filled with an eruption of towering Cumulus clouds, there’s a good chance tranquility will be upended by thunderstorms packing gale force or greater gusts. In just minutes the open roadstead can become a survival episode with a lee shore just to leeward.
AN OCEANOGRAPHY LESSON
Long range forecasts provide a window on the future and can deliver an early warning that lets you avoid rather than endure a heavy weather encounter. This storm avoidance game plan involves monitoring both the current weather analysis and future forecasts, plus having some contingency plans in the works. It hinges on a keen awareness of risk levels for various passages, anchorages, mooring fields and docking options. And the goal is to mimic the old Kenny Rogers country western song “The Gambler” and knowing the nautical equivalent of when to “hold-em,” when to “fold-em” and “when it’s time to run”. This is when a skilled skipper puts marine forecasts to their best use.
Acquiring meteorological knowledge is important, but teaming it up with oceanographic awareness is even better. Sailing is a lab lesson in both sciences, and learning a bit about how energy transfer works at the atmosphere/ ocean interface beats discovering it the hard way. I recall sailing my 26-foot Excalibur sloop, Intuition out of Ventura, Harbor in Southern California. The wind was light, but a long period powerful ocean swell was rolling in from the northwest. Waves sweeping over the shoals near the jetties and breakwater were forming plunging breakers. But the channel remained free of breaking waves.
The first thing I had failed to take into account was the influence of the river mouth just down coast of the Marina, and how the coastal current, light westerly and large swell would interact. The wind and current were from the same direction causing the apparent wind to decrease.
My goal was to sail toward deeper water as quickly as possible. I could point in the right direction, but progress was slow and the boat was being side-set by the strong down coast current. It didn’t take long to realize that where I was headed was not where I was going.
As the leeway increased, it became clear that I was going sideways toward river mouth sand bars rather than deeper water. Years of surfing in Southern California gave me a pretty good feel for the danger that lay ahead. I knew it was time to tack and try and motor away from the surf zone. The 6 hp outboard started first pull but only added a little more speed and a slight improvement in pointing ability. However, it looked like I would clear the shoals and breaking waves.
Youth and inexperience prevailed, and I returned to a starboard tack. What I hadn’t anticipated was how the smaller rollers caused Intuition to pitch, ventilating the propeller and causing headway to decrease. I knew how deceiving a long period wave train generated by an Aleutian Gulf low could be. The lulls between larger sets lured me on like an insect to a carnivorous plant. I’d yet to study the rule of significant wave height and how long period swells have a resonant effect on the surf breaking on a bar.
Exiting a surf zone at three to four knots is like running away from falling boulders at a slow walk. I had waited too long to tack over and head back, against the current, to safety. The commitment, a foolish one, had been made and I was betting on getting over the outer bar before or after the next big set arrived. The swells and boat arrived at the shoal simultaneously.
The first wave presented as a big mound of green water that lifted Intuition’s bow dropped our speed to nil but did not break. The down slopping back of the unbroken wave slid us back into action but the next wave, noticeably larger, steeper and more menacing started to succumb to shallow water and the pull of gravity. The face steepened and it felt like someone pushed an elevator’s up button. Having way too much familiarity with what we surfers refer to as “going over the falls”, I knew what would happen next.
The thought of an “over the falls” episode in a 26-foot sailboat held no appeal. This time, Poseidon was on the sailors side and just as Intuition reached the crest, lost way, and felt like she would drop stern first into the trough, the pending plunge became a slow motion, mushy collapse of the spreader high wave. Intuition was surrounded with white water and looked like a candle in a lemon meringue pie. Another lesson learned the hard way—but it could have been much worse.
This is when, as a biology major in grad school, I started taking physical oceanography courses. Authors like Willard Bascom and his book Waves and Beaches linked weather-borne seas to ocean swells and described their shallow water terminus—a sequence every sailor should know and respect. Offshore sailor and oceanographer, Dr Frank Bohlen is one of the best messengers regarding the moods of the Gulf Stream and how rapidly developing low pressure systems with gale winds or storm-force nor’easters can create seas are more than double the significant wave height. This is why every experienced ocean sailor learns to couple weather change with oceanographic effect.
Acquiring weather forecasts is not the same as developing a well-grounded understanding of marine weather. Most electronics manufacturers offer hardware that can receive and display, on the system’s MFD, forecasts, GRIB files, and weather graphics. The information is quite useful and easy to discern but it’s put to best use by those with a good working understanding of basic marine weather.
When it comes to weather awareness, it’s vital to think in three-dimensions. We tend to have a two-dimensional fixation about wind direction; where it’s coming from and where we want to go. But weather involves convergence and divergence of air in a very 3D context. The updrafts and downdrafts of thunderstorms are a case in point.
On a larger scale, troughs and ridges in the mid atmosphere (approximately 18,000 feet) shuttle air to and from the surface. All this is spelled out on 500MB charts and by understanding what they indicate, a sailor can get a feel for how supercharged a nearby surface low will become and where it’s likely to be headed.
Once again, the National Weather Service (NWS) is where to go. It tells the whole story, from data gathering to analysis and forecast development. It’s all online, enriched with useful graphics and brimming with in-depth explanations of how surface weather is influenced by the west to east wind dynamics and temperature changes at mid-levels of the atmosphere.
The following websites represent a good cross section of useful weather info for sailors. It’s important to keep in mind that most bad weather affecting the east coast originated over the continental U.S. and for west coast sailors, bad weather stems from low pressure systems that develop in the Pacific and intensify as they approach landfall.
Another good way to improve your weather awareness is by perusing a couple of NWS websites over your morning cup of coffee.
Ocean Prediction Center. A mainstay for acquiring NWS ocean forecasts and analysis maps, text products and voice broadcasts (www.ocean.weather.gov).
Hurricane Center. Dedicated to hurricane season development of tropical weather. Tracks, forecasts disturbances, depressions, tropical storms, hurricanes (www.nhc.noaa.gov).
Storm Prediction Center. A land/coastal source of mesoscale forecasts and radar overlays, that are quite useful for coastal sailors (www.spc.noaa.gov).
National Data Buoy coastal and offshore weather buoys that report near real time wind speed/direction, temperature, barometric data—a great means of confirming forecast accuracy.
JetStream– an online school of weather an excellent starting point that fills in the basics and gives users enough information to make better use of NWS forecast sites.

Meteorology has made some astounding strides forward since pioneers like Fitzroy, Dalton and Ballot and Celsius pondered the atmosphere. These advances include directly measuring the weather with instruments ranging from thermometers and barometers to weather balloon launches and satellites with optical, infrared and microwave instrumentation. One of the most recent quests is determining how a warming atmosphere and increases in ocean temperature influences storm volatility. Most research points to an uptick in storm frequency and intensity.
The thin veil of air surrounding the Earth is constantly in motion. Heat drives the equation, causing parcels of air to rise. The Coriolis effect adds a spin and forces upper level jet streams to follow a predominantly west-to-east pathway as they circle the globe. The lower level of the Polar and Sub- Tropical Jet Streams have a major effect on the intensification and directional guidance of surface low pressure systems and where they will go. It’s this parade of alternating storms and sunshine, marching west to east, that stereotypes midlatitude weather.
Closer to the equator, easterly winds are dominant for much of the year. Tropical weather cruising grows dangerous when these easterly trade winds diminish, and warm core storms often evolve into hurricanes that actually transfer heat from the tropics toward the poles. The only good news about tropical storms is that their diameter is usually much smaller than the fall, winter, spring extra-tropical storms that haunt the temperate regions of the Atlantic and Pacific and Great Southern Oceans.
This broad-brush overview of marine weather topics highlights what’s covered on NWS affiliate websites and what you need to know in order to put NWS forecasts to best use.
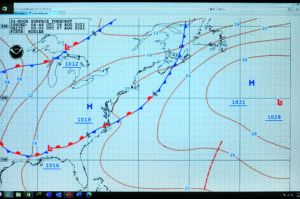
First of all take note of the difference between an analysis and a forecast. The former involves measurement of factors such as temperature, pressure, dewpoint, wind speed/direction, altitude, sea state etc. And the weather map dubbed an “Analysis” defines weather that’s recently occurred. It’s accuracy is in a large part due to the sampling done and it forms a key departure point upon which “forecasts” will be made. Forecasts are predictions based upon trends measured in the analysis and intricate computer calculations referred to as modeling.
Weather is dynamic and most often non linear, so it’s no surprise that the 24- and 48-hour forecasts will prove more accurate than the 72- and 96-hour forecasts. Just as a navigator’s dead reckoning gets more inaccurate as time goes on, a weather forecast grows more unreliable as the forecast time span increases. The goal of delivering a reliable 7-day marine forecast is a noble one, but the algorithms used to do so fail to deliver the validity and reliability of a 24-hour or 48-hour forecast. This means that the 7-day forecast is a helpful tool, but needs to be used in conjunction with more frequent updates. When bad weather is imminent, weather updates may be done several times a day. One of the best applications of rapid data updating is the NWS near real time doppler radar graphic at www.radar.weather.gov . It provides accurate microwave derived tracking of thunderstorms in coastal waters.


